
- Moving the markets
The markets were caught off guard by a double whammy of bad news, and they took a dive. On one hand, bond yields rose again, signaling higher borrowing costs and inflation fears. On the other hand, China’s economy showed signs of slowing down and struggling with debt.
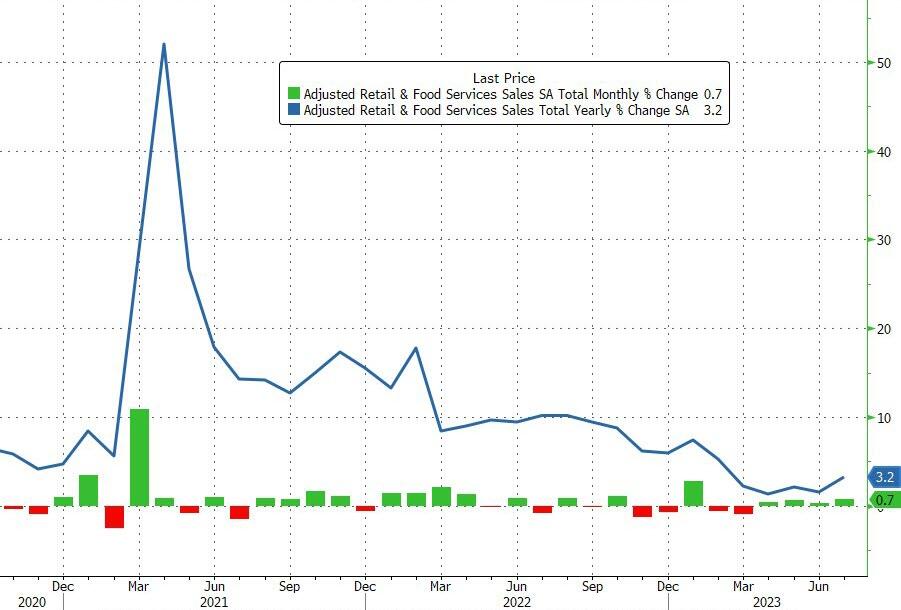
Meanwhile, the US economy seemed to be doing well, at least on the surface. Retail sales in July beat expectations, rising by 0.7% month-over-month and accelerating year-over-year. This was the best performance since January.
But as traders know, good news can be bad news when it comes to the Fed. The strong retail sales data could mean that the Fed will not pause its rate hikes anytime soon.
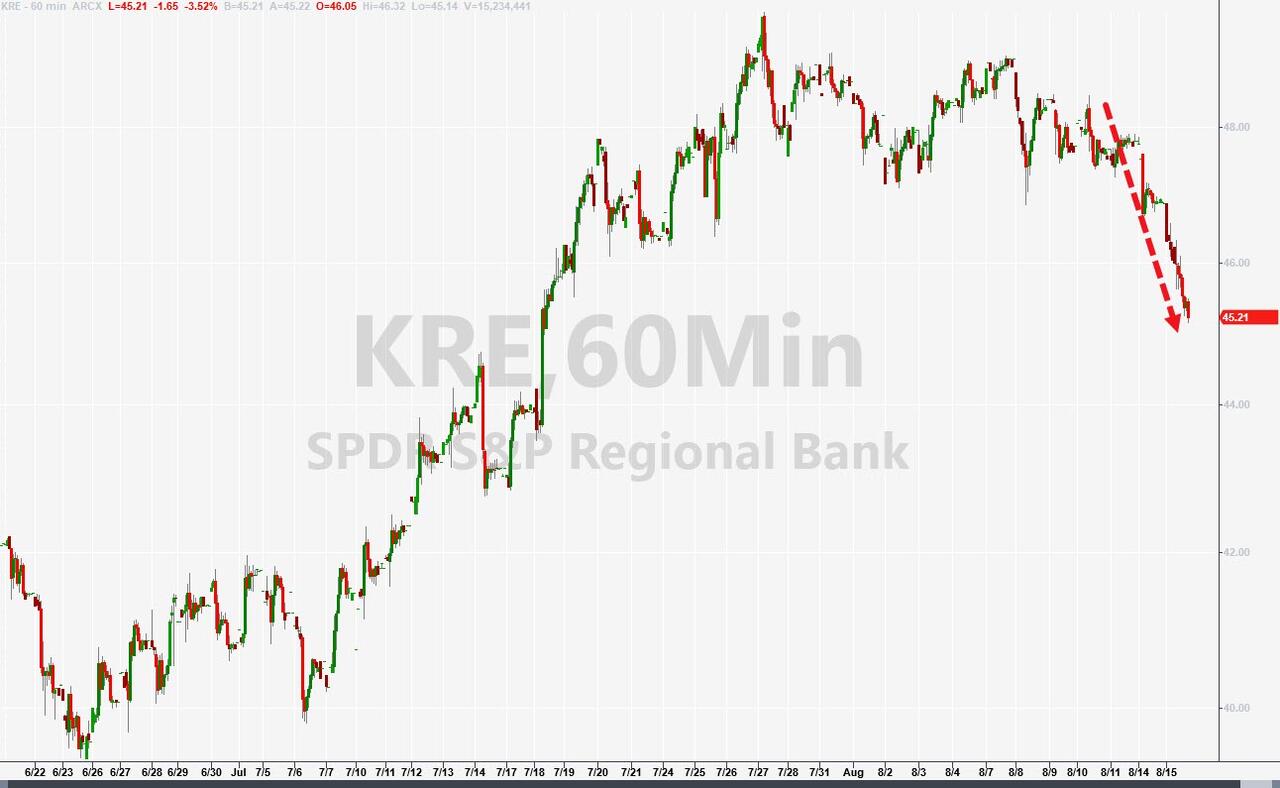
The banking sector was hit hard by a warning from Fitch, a rating agency, that it might downgrade dozens of banks and put others on a watchlist. I told you months ago that the banking crisis was not over yet, and neither was the inflation monster.
Fed official Neel Kashkari added some fuel to the fire by calling for more capital regulations and more rate hikes to tame inflation. He said that if inflation got out of control, the banks could face more losses and more pressure in the future.
No kidding: we haven’t seen the worst of it yet.
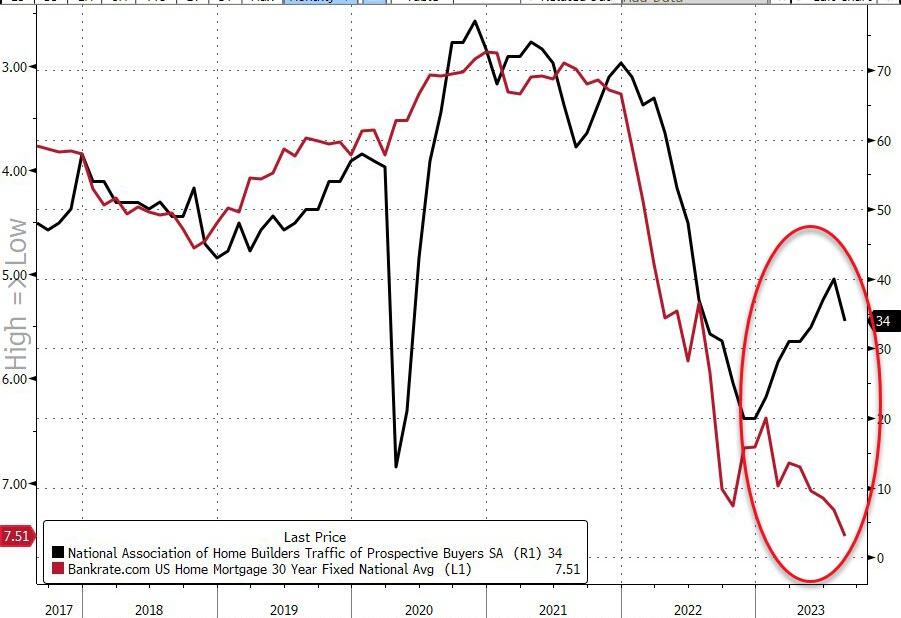
Homebuilder confidence also took a hit today, as the housing market cooled off amid rising costs and supply shortages.
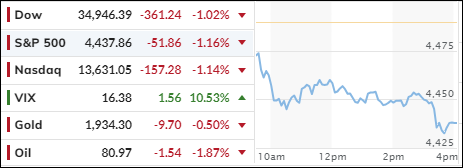
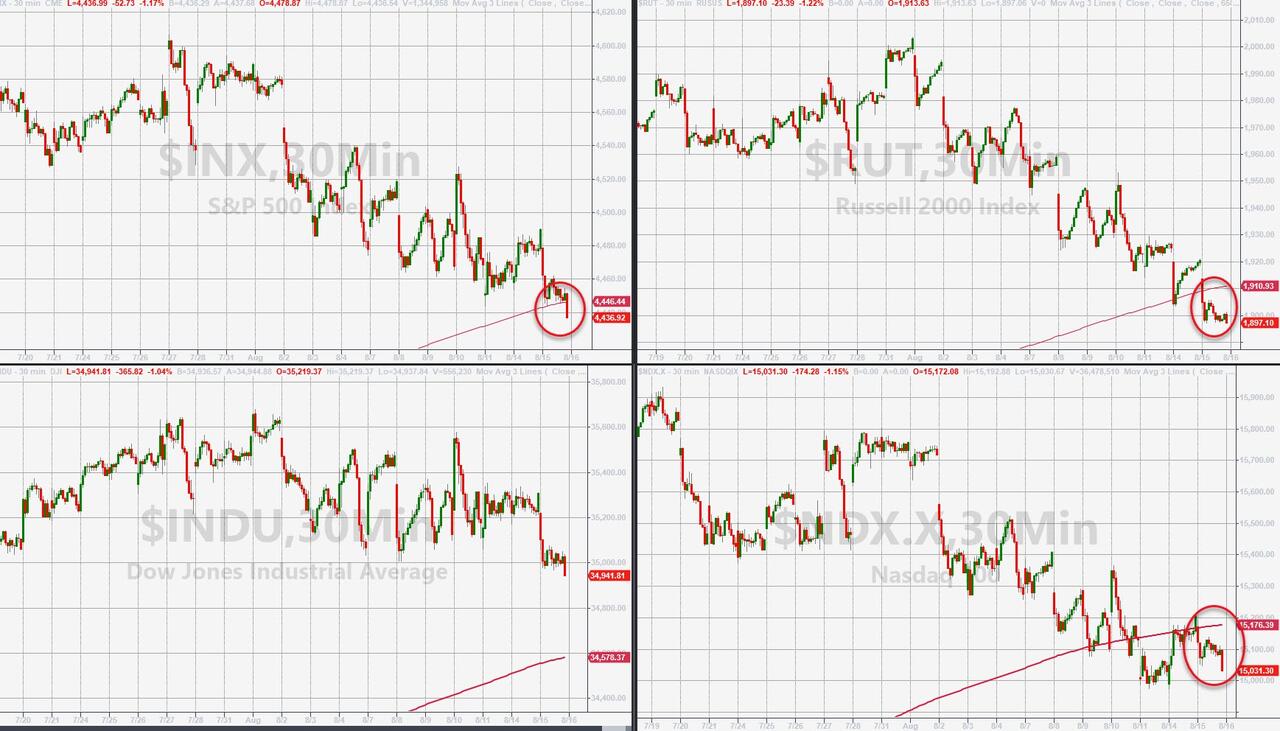
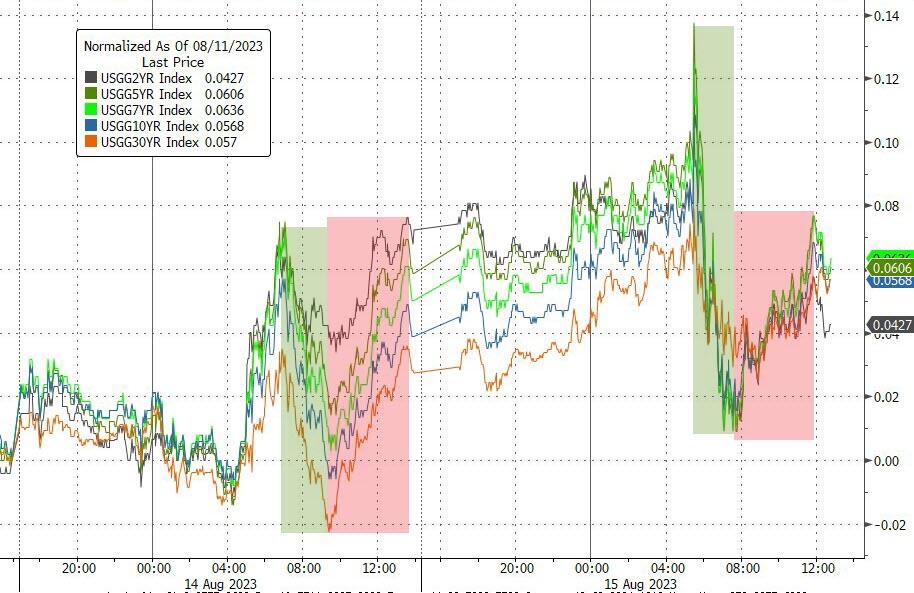
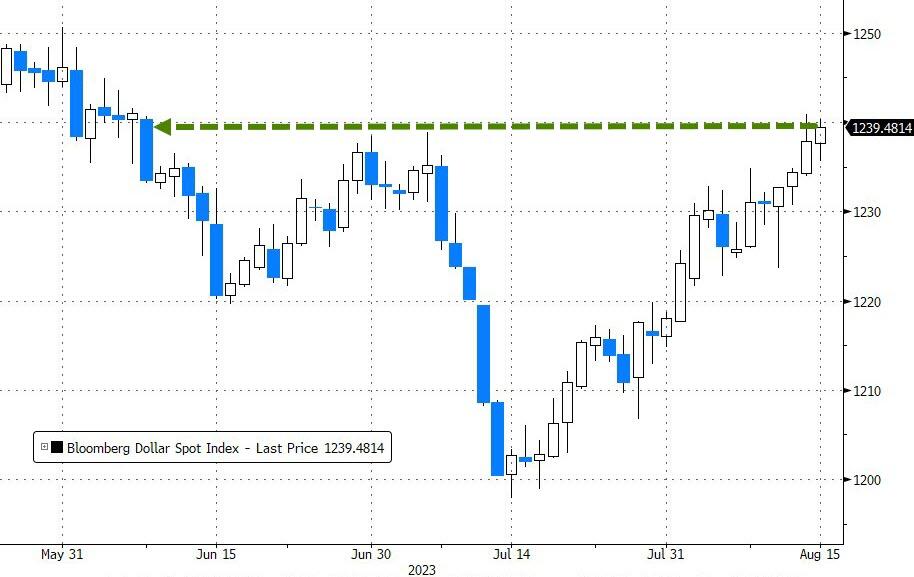
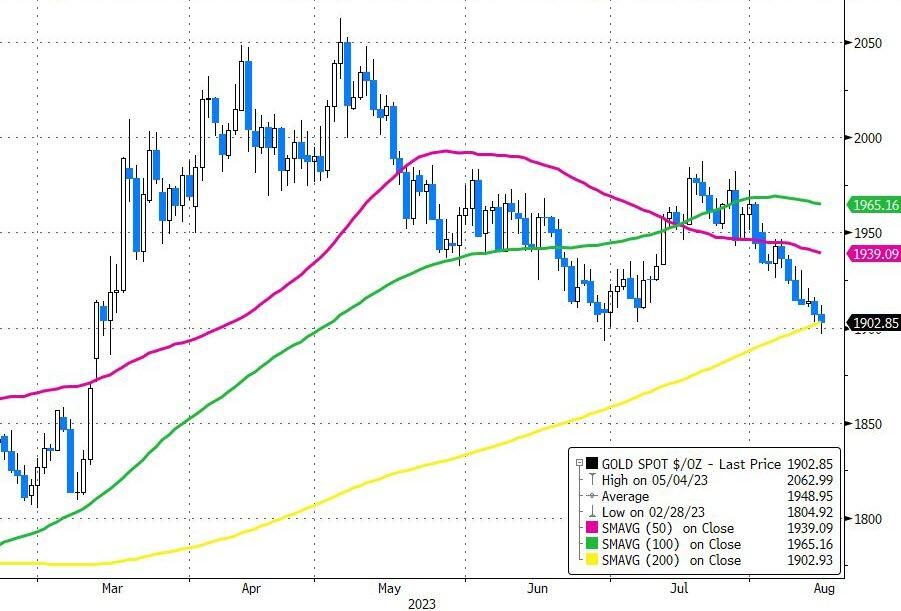
The major US stock indexes got clobbered, with the S&P 500, Nasdaq and Small Caps dropping below their respective 50-day moving averages. Bond yields ended the session mixed, the dollar held on to yesterday’s gains, and gold tested its 200-day moving average and found support.
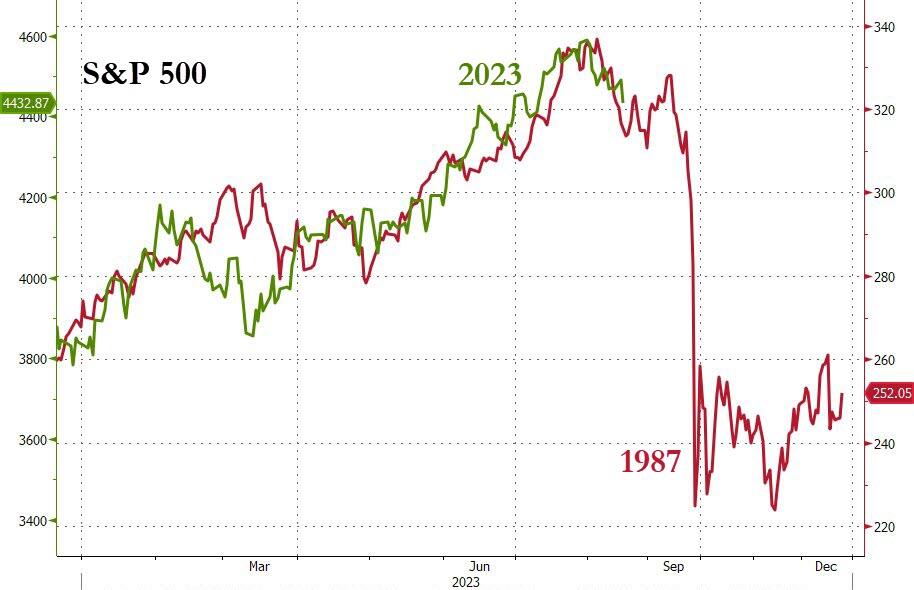
And just for fun, here’s a chart from ZeroHedge that compares the S&P 500 today with its performance in 1987, right before the infamous Black Monday crash.
No… that can’t happen again, right?
- “Buy” Cycle Suggestions
The current Buy cycle began on 12/1/2022, and I gave you some ETF tips based on my StatSheet back then. But if you joined me later, you might want to check out the latest StatSheet, which I update and post every Thursday at 6:30 pm PST.
You should also think about how much risk you can handle when picking your ETFs. If you are more cautious, you might want to go for the ones in the middle of the M-Index rankings. And if you don’t want to go all in, you can start with a 33% exposure and see how it goes.
We are in a crazy time, with the economy going downhill and some earnings taking a hit. That will eventually drag down stock prices too. So, in my advisor’s practice, we are looking for some value, growth and dividend ETFs that can weather the storm. And of course, gold is always a good friend.
Whatever you invest in, don’t forget to use a trailing sell stop of 8-12% to protect yourself from big losses.
- Trend Tracking Indexes (TTIs)
The markets had a bad day today, losing more than 1% of their value. There was no safe haven for investors, as our Trend Tracking Indexes (TTIs) also declined sharply.
The TTIs are indicators that measure the direction and strength of the market trends. They are still in the bullish zone, meaning that the market is expected to rise, but they are getting closer to the tipping point.
This is how we closed 08/15/2023:
Domestic TTI: +2.68% above its M/A (prior close +4.05%)—Buy signal effective 12/1/2022.
International TTI: +4.26% above its M/A (prior close +5.27%)—Buy signal effective 12/1/2022.
All linked charts above are courtesy of Bloomberg via ZeroHedge.
Contact Ulli