
- Moving the markets
The Fed’s July meeting minutes have caused quite a stir in the market today. Traders are struggling to swallow the bitter pill of rising rates, along with a mixed bag of earnings and economic data.
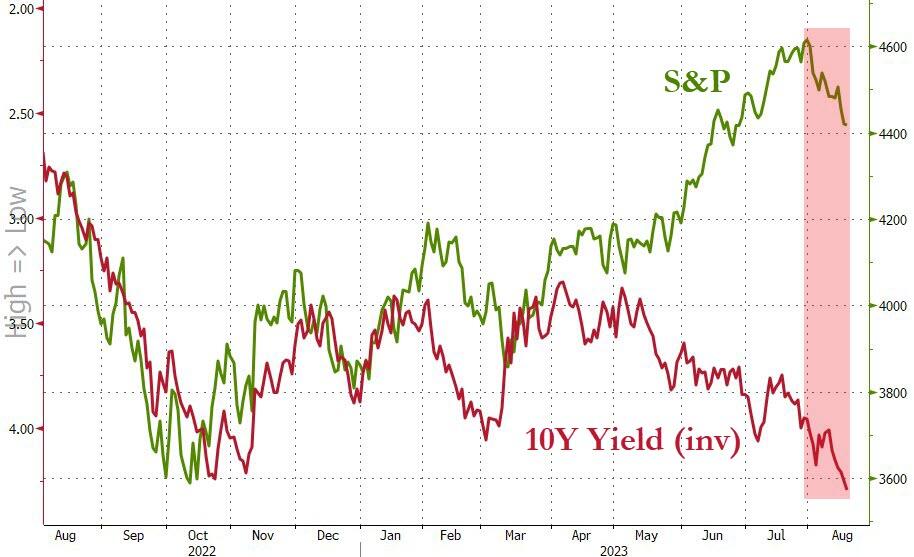
The 10-year bond yield jumped to its highest level since last October, and rates across the board (including globally) are climbing higher. The Fed’s latest words confirmed that they are still worried about inflation getting out of hand.
Even Walmart couldn’t save the day, despite beating earnings and revenue expectations and raising its full-year guidance. The stock fell by 2%.
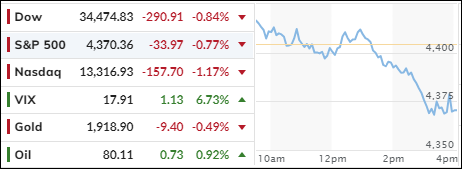
It’s been a rough August so far, as the major indexes are on track for another losing week. The S&P 500 has given up -4.8% month to date. It seems that sentiment has changed, and traders have switched from “Buy the dip” to “Sell the rip,” a rare phenomenon in the market.
Of course, this shouldn’t be a surprise, considering that the gains of the first half of 2023 came mostly from the AI related rally, as well as the hope that the Fed would change its mind from hawkish to neutral or even dovish. But that hope may have been a mirage, hence the change in sentiment.
Sure, this could be just a minor setback and eventually turn out to be a buying opportunity on the way to another bull run, but that won’t happen without the Fed’s help.
If nothing else works, the bulls can always try another short squeeze, but that hasn’t worked either. The most shorted stocks have declined 12 of the last 13 days.
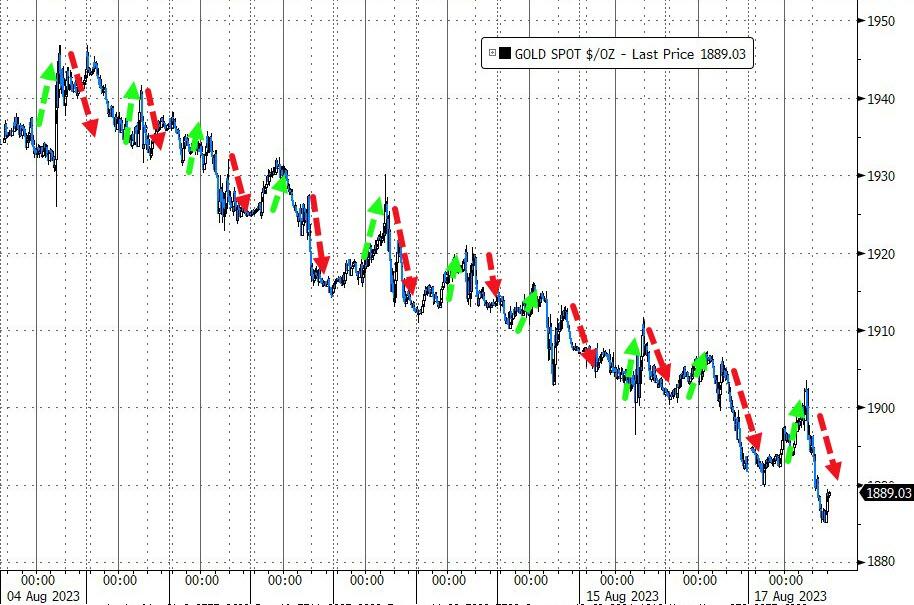
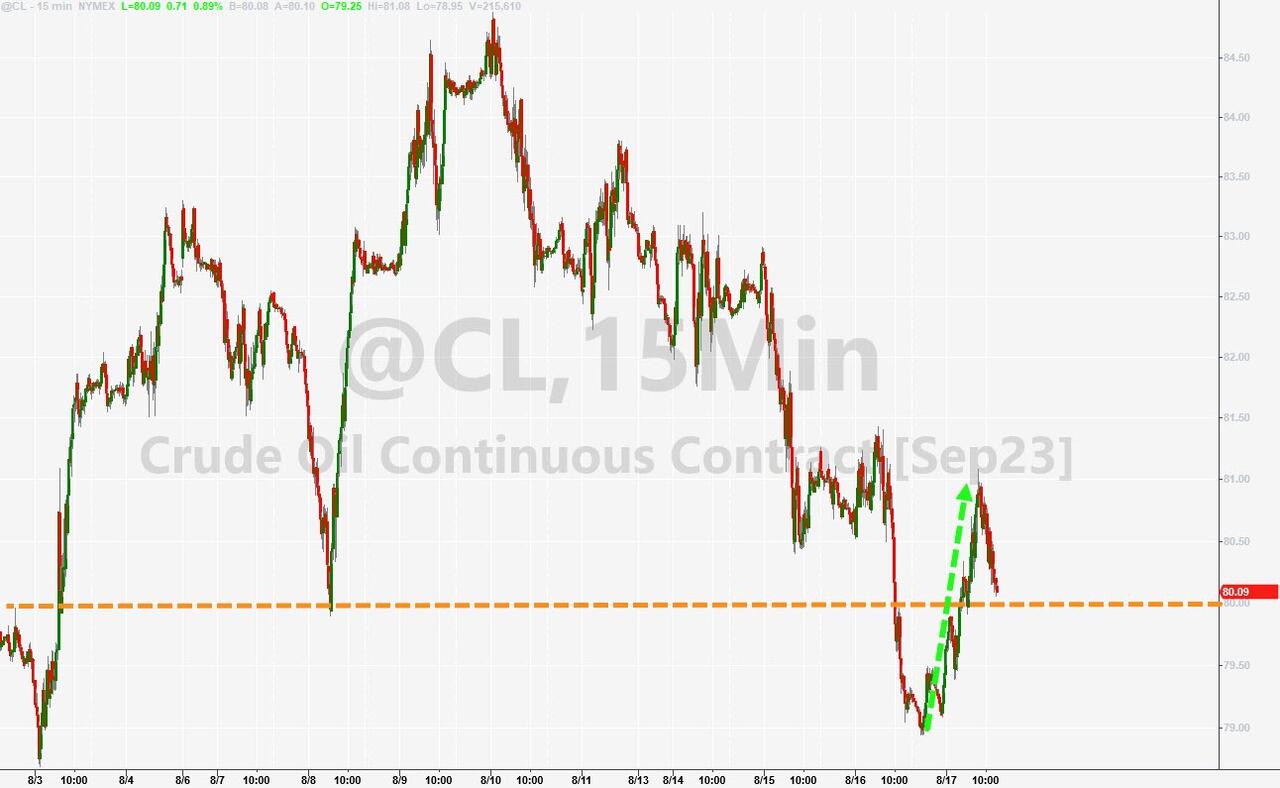
The dollar was flat, and gold continued its downward trend, while crude oil reclaimed its $80 level.
Surprisingly, stocks and bonds sank together, which means, if this continues, the S&P 500 has some 800 points to go before it catches up with HYG, as this chart shows.
Ouch! You better have your exit strategy ready, as we are approaching a possible domestic “Sell” signal (section 3).
- “Buy” Cycle Suggestions
The current Buy cycle began on 12/1/2022, and I gave you some ETF tips based on my StatSheet back then. But if you joined me later, you might want to check out the latest StatSheet, which I update and post every Thursday at 6:30 pm PST.
You should also think about how much risk you can handle when picking your ETFs. If you are more cautious, you might want to go for the ones in the middle of the M-Index rankings. And if you don’t want to go all in, you can start with a 33% exposure and see how it goes.
We are in a crazy time, with the economy going downhill and some earnings taking a hit. That will eventually drag down stock prices too. So, in my advisor’s practice, we are looking for some value, growth and dividend ETFs that can weather the storm. And of course, gold is always a good friend.
Whatever you invest in, don’t forget to use a trailing sell stop of 8-12% to protect yourself from big losses.
- Trend Tracking Indexes (TTIs)
The market was shaken by soaring bond yields, which reached their highest levels in 15 years. Stocks fell for the third day in a row, and our TTIs were also affected. The domestic index is close to breaking its trend line and turning negative.
We haven’t crossed that line yet, but it won’t take much more to make us exit the markets.
This is how we closed 08/17/2023:
Domestic TTI: +1.14% above its M/A (prior close +1.93%)—Buy signal effective 12/1/2022.
International TTI: +2.81% above its M/A (prior close +3.33%)—Buy signal effective 12/1/2022.
All linked charts above are courtesy of Bloomberg via ZeroHedge.
Contact Ulli