
ETF Tracker StatSheet
You can view the latest version here.
THE STOCK MARKET BUBBLE AND THE TRILEMMA: WHAT’S NEXT?
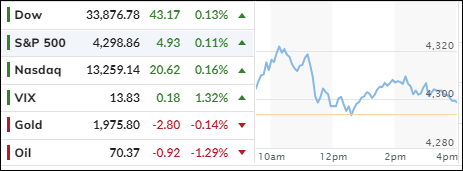
[Chart courtesy of MarketWatch.com]
- Moving the markets
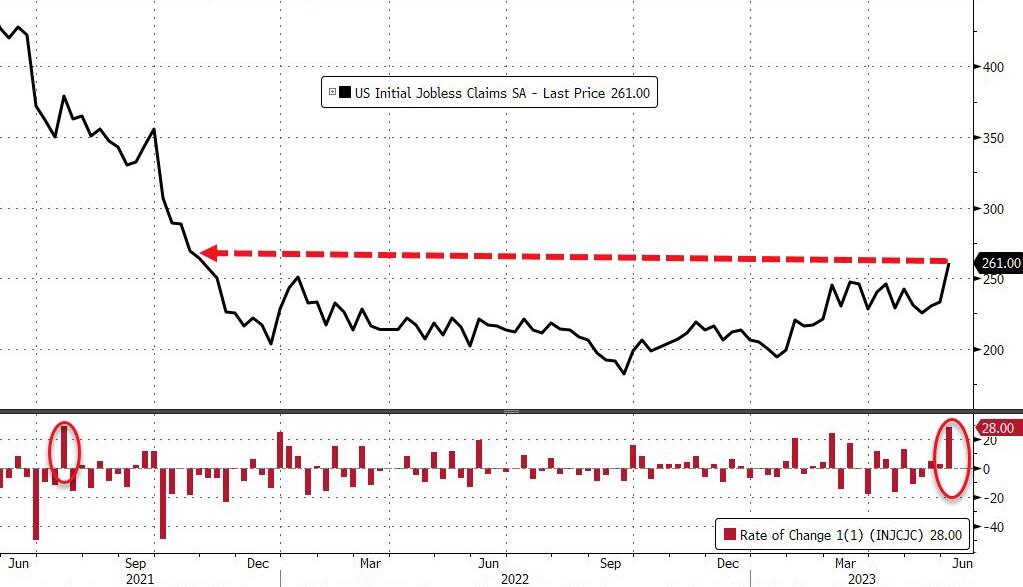
The tech rally seems unstoppable, even as the economy struggles. Just look at the latest jobless claims, which hit a new high since last October. Sure, some people found work and left the benefit rolls, but that’s hardly a sign of recovery.
Meanwhile, the stock market is living in its own bubble, ignoring the bad news and cheering for more stimulus. The S&P 500 reached a new record of 4,300 before retreating slightly, ending the week with a modest gain of 0.4%.
But it’s not all doom and gloom. Some other sectors, like small caps, are joining the party, making the rally more broad-based and sustainable. If this trend continues, investors might become more optimistic and confident.
Of course, a lot depends on what happens next week. We’ll get the latest inflation data, which is expected to show some improvement. And we’ll hear from the Fed, which might pause its rate hikes for a while. That would be music to the ears of the bulls, who are betting on more easy money.
But what if they’re wrong? What if inflation is worse than expected, or the Fed sticks to its hawkish stance? Then we might see a reversal of fortunes, with the bears taking over and the bulls running for cover.
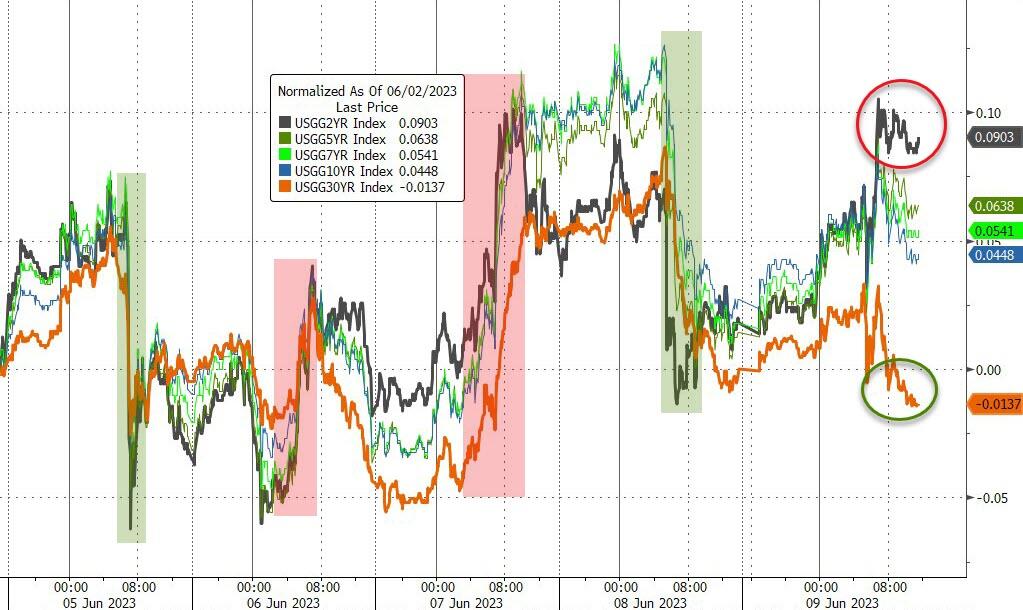
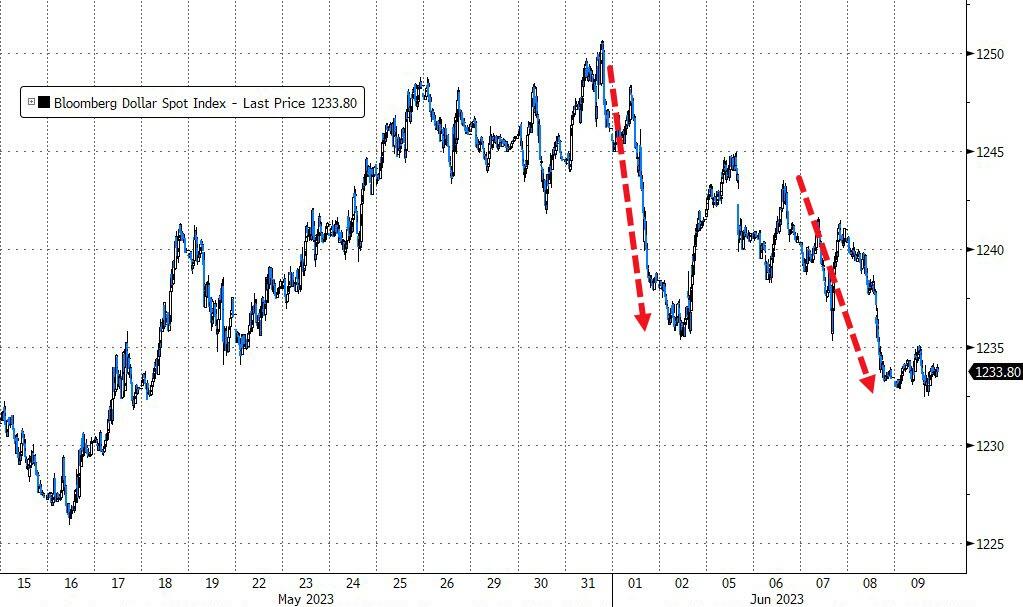
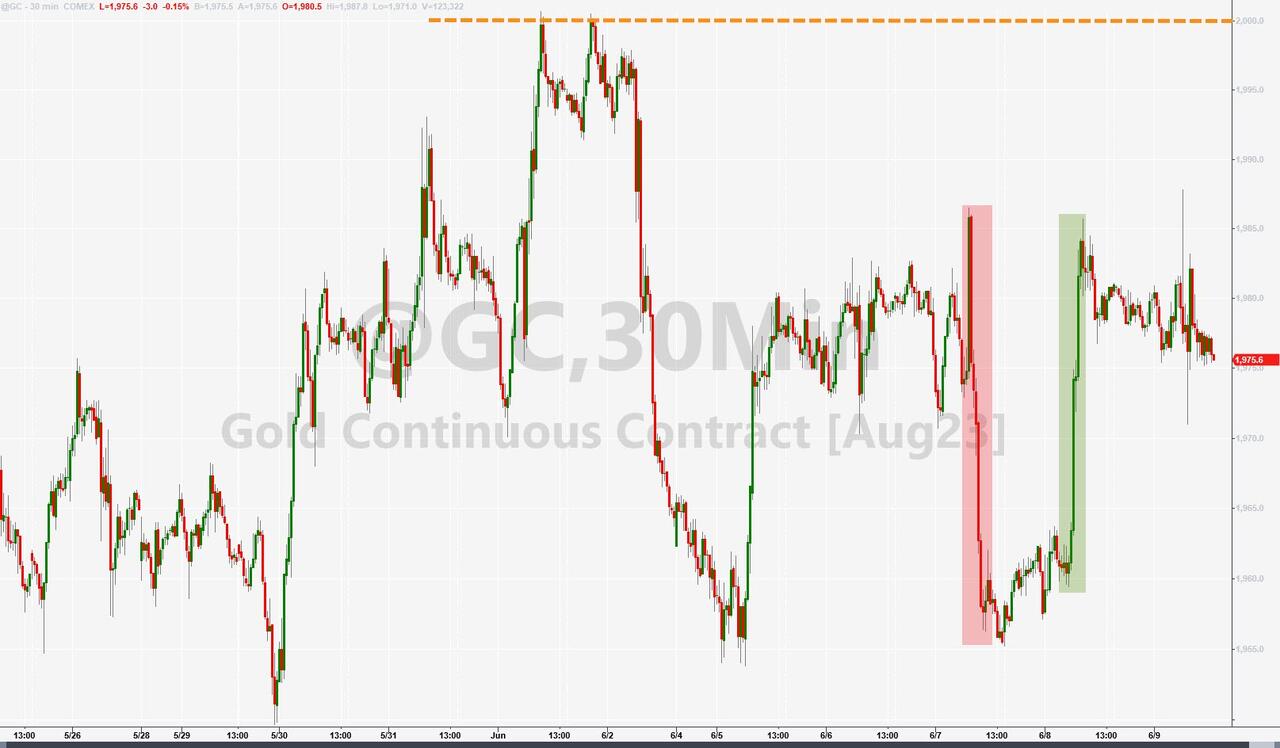
The bond market was mixed this week, with short-term yields rising and long-term yields falling. The dollar weakened for the second week in a row. Gold had a good run but also faced some volatility.
We’re in a tricky situation right now, as ZeroHedge puts it, with three things that don’t make sense together: the dollar, tech stocks and real rates. Can you spot the odd one out in this chart?
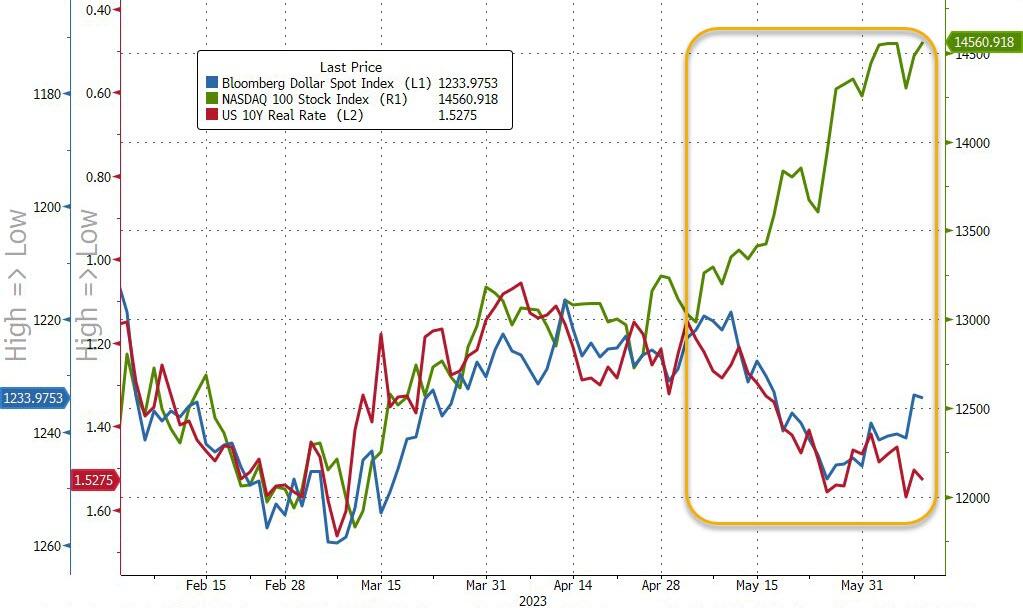
- “Buy” Cycle Suggestions
The current Buy cycle began on 12/1/2022, and I gave you some ETF tips based on my StatSheet back then. But if you joined me later, you might want to check out the latest StatSheet, which I update and post every Thursday at 6:30 pm PST.
You should also think about how much risk you can handle when picking your ETFs. If you are more cautious, you might want to go for the ones in the middle of the M-Index rankings. And if you don’t want to go all in, you can start with a 33% exposure and see how it goes.
We are in a crazy time, with the economy going downhill and some earnings taking a hit. That will eventually drag down stock prices too. So, in my advisor’s practice, we are looking for some value, growth and dividend ETFs that can weather the storm. And of course, gold is always a good friend.
Whatever you invest in, don’t forget to use a trailing sell stop of 8-12% to protect yourself from big losses.
- Trend Tracking Indexes (TTIs)
Our Domestic Trend Tracking Index (TTI) dipped slightly but still shows a bullish trend. Next week will be crucial for the market, as investors are hoping for some positive news. If they are disappointed, we might see some volatility.
This is how we closed 06/09/2023:
Domestic TTI: +2.30% above its M/A (prior close +2.45%)—Buy signal effective 12/1/2022.
International TTI: +6.61% above its M/A (prior close +6.75%)—Buy signal effective 12/1/2022.
All linked charts above are courtesy of Bloomberg via ZeroHedge.
———————————————————-
WOULD YOU LIKE TO HAVE YOUR INVESTMENTS PROFESSIONALLY MANAGED?
Do you have the time to follow our investment plans yourself? If you are a busy professional who would like to have his portfolio managed using our methodology, please contact me directly to get more details.
Contact Ulli