
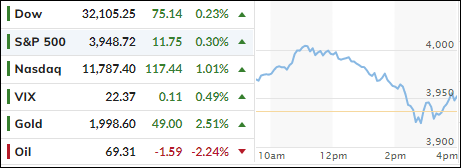
- Moving the markets
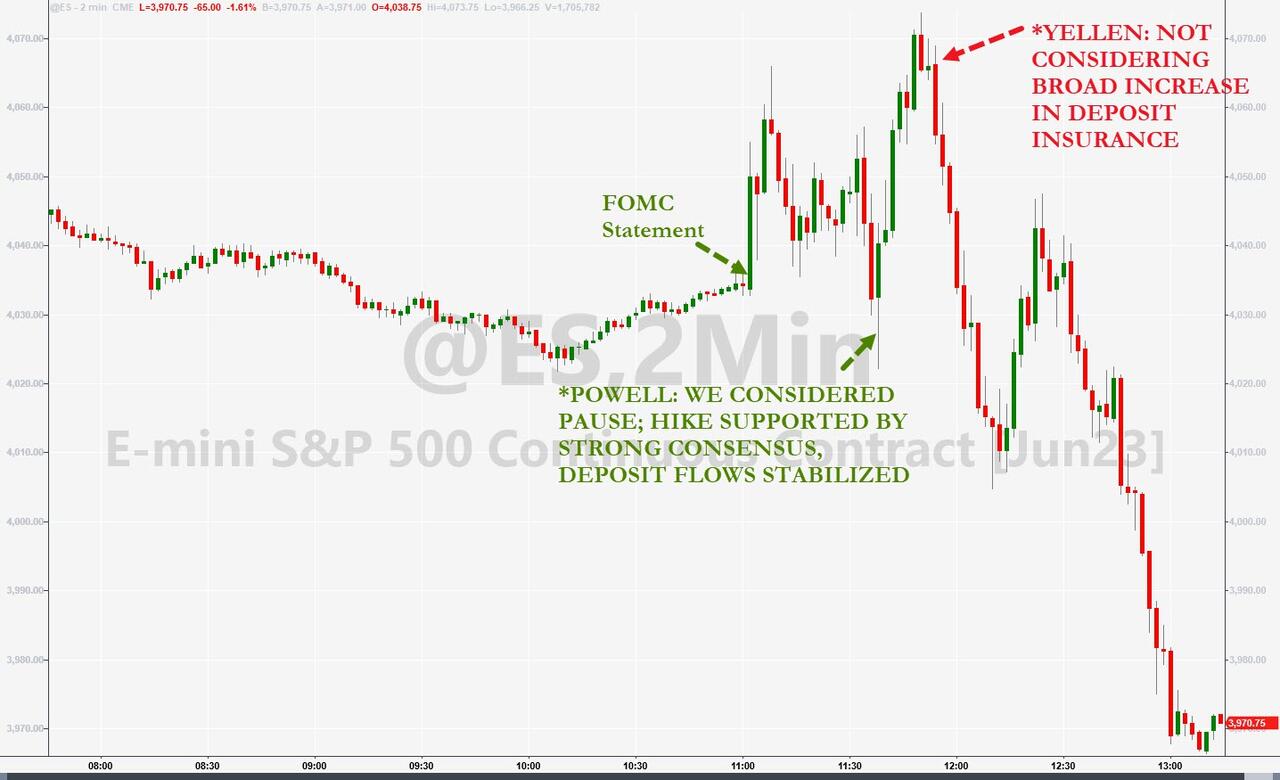
After the Fed pretty much met expectations yesterday with their latest policy on interest rates, which some saw as Powell being in the dovish camp, it was Treasury Secretary Yellen who stole the jam out of the bullish donut by clarifying that a broad increase in deposit insurance may not be in the cards.
Some analysts considered it to be a flip-flop, and the fallout was instant, as the markets crashed into the close, with the Dow plunging 530 points.
Today, it was “opposite day”, as bottom pickers stepped up to the plate and drove the Dow higher by over 450 points, assuming the much hoped for Fed pivot had now become reality. However, suddenly a glass ceiling was hit, the trend reversed and sent the major indexes back into the red. A last hour bounce insured a green close.
It turned out to be another chaotic day with uncertainty reigning supreme and a long-term trend in equities not being discernable.
Fed-watcher Philip Marey summed it up best:
“A final observation. The Fed continues to stumble its way through the fight against inflation. First, they tried to explain inflation away by claiming it was transitory. Consequently, they were late in starting the hiking cycle. Now that they are finally approaching positive territory for the real federal funds rate, they are close to ending the hiking cycle and leaving the rest of the fight against inflation to credit tightening by the banks. Because the Fed in its regulatory role failed to prevent the recent banking turmoil. Failing as a central bank on both fronts, so now it’s up to the banking sector to get inflation under control? What a mess.”
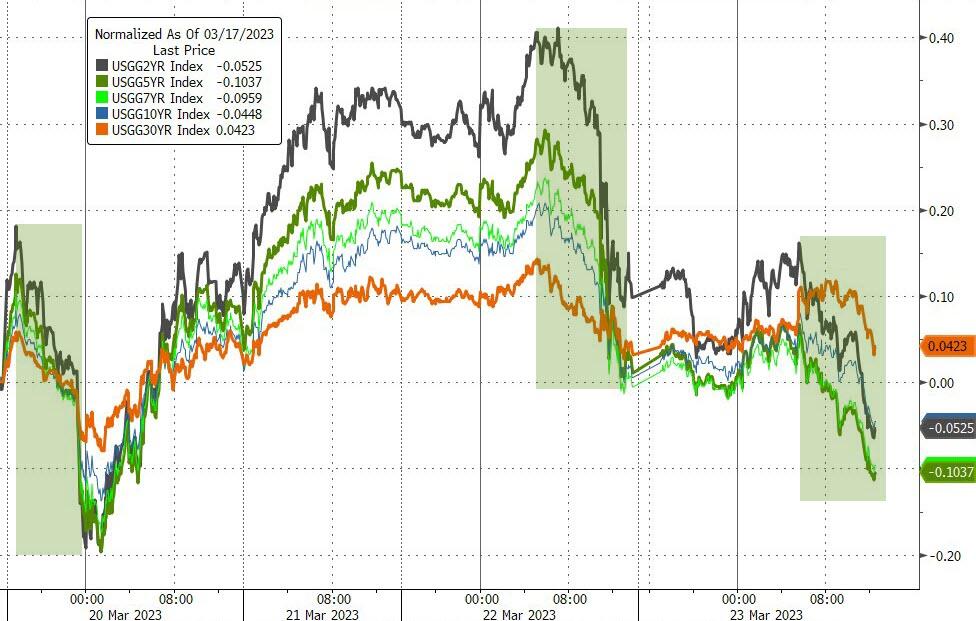
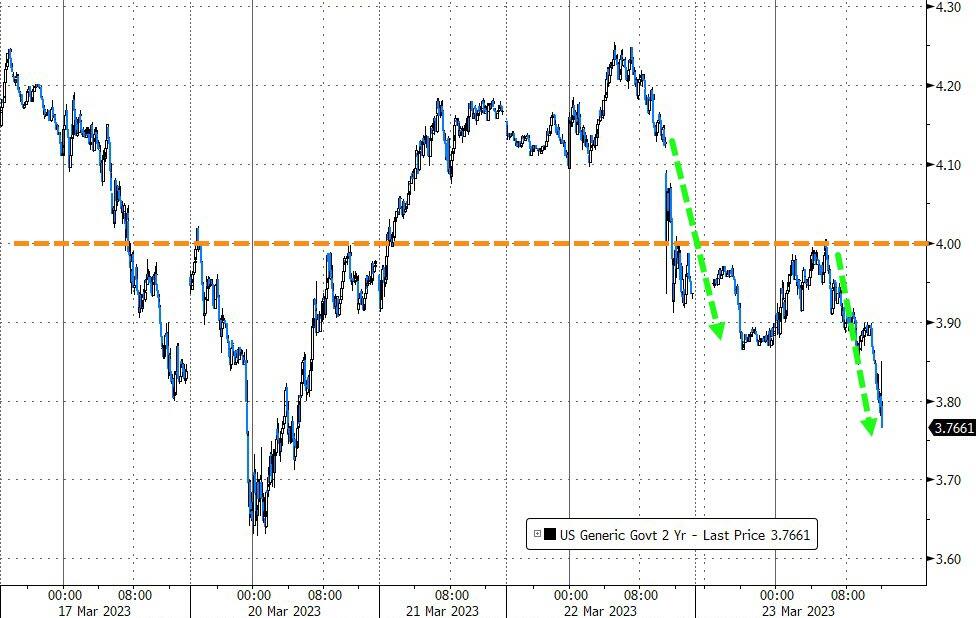
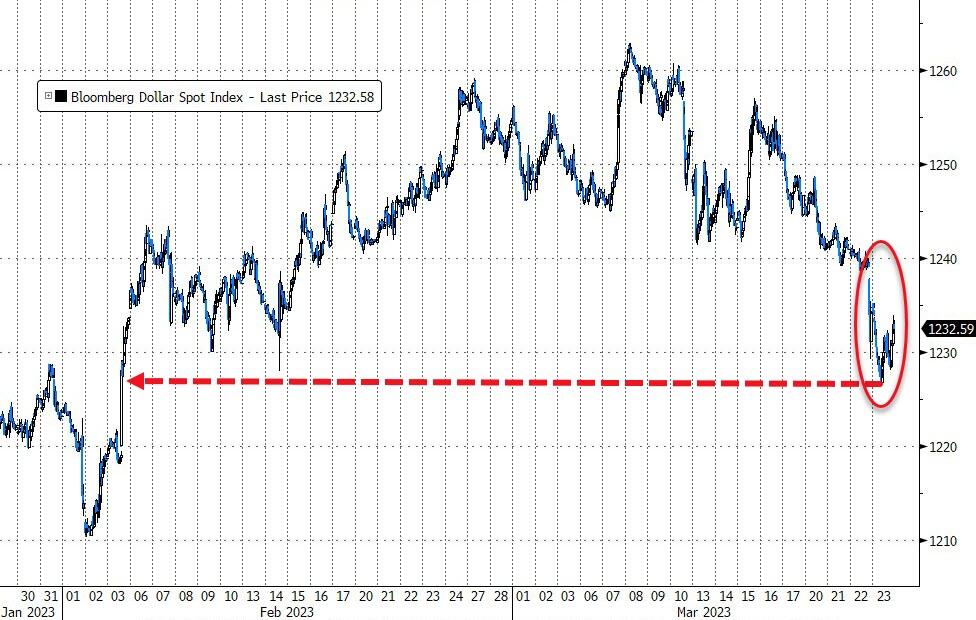
Bond yields were mixed. The 2-year dropped, popped, touched its 4% level, and then really dropped to close at 3.77%. The US Dollar fell for the 6th straight day but bounced into the close.
Again, the hero was Gold, with the precious metal surpassing its $2k level and closing a tad above it. For the day, gold gained +2.63%, YTD it’s up +9.49%, which is way better than the S&P’s meager +2.80%.
2. “Buy” Cycle Suggestions
For the current Buy cycle, which started on 12/1/2022, I suggested you reference my then current StatSheet for ETF selections. However, if you came on board later, you may want to look at the most recent version, which is published and posted every Thursday at 6:30 pm PST.
I also recommend you consider your risk tolerance when making your selections by dropping down more towards the middle of the M-Index rankings, should you tend to be more risk adverse. Likewise, a partial initial exposure to the markets, say 33% to start with, will reduce your risk in case of a sudden directional turnaround.
We are living in times of great uncertainty, with economic fundamentals steadily deteriorating, which will eventually affect earnings negatively and, by association, stock prices. I can see this current Buy signal to be short lived, say to the end of the year, and would not be surprised if it ends at some point in January.
In my advisor practice, we are therefore looking for limited exposure in value, some growth and dividend ETFs. Of course, gold has been a core holding for a long time.
With all investments, I recommend the use of a trailing sell stop in the range of 8-12% to limit your downside risk.
3. Trend Tracking Indexes (TTIs)
Our TTIs dropped again, as another chaotic day on Wall Street did nothing but cast more doubt in traders’ minds as to which direction equities will be going.
This is how we closed 03/23/2023:
Domestic TTI: -3.13% below its M/A (prior close -2.81%)—Buy signal effective 12/1/2022.
International TTI: +3.85% above its M/A (prior close +3.95%)—Buy signal effective 12/1/2022.
All linked charts above are courtesy of Bloomberg via ZeroHedge.
Contact Ulli