
ETF Tracker StatSheet
You can view the latest version here.
WINNING FOR THE DAY BUT LOSING FOR THE WEEK
- Moving the markets
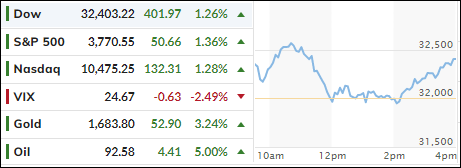
It was chaotic session indeed, as the Dow jumped to an early 500-point gain, only to see it evaporate in no time, with the index diving into the red, before dip buyers pulled equities back above their respective unchanged lines to a solid green close. However, for the week, the Dow snapped its four-week win streak.
ZeroHedge summed up the day’s news like this:
- Good: payrolls beat expectations (tightening not working – bad for stocks)
- Bad: wage growth slowed modestly (less-flation – good for stocks?), full-time workers dropped 490k (economic weakness – not good for stocks)
- Ugly: number of unemployed Americans highest since Feb (recession reality – bad for stocks)
October’s nonfarm payrolls surprised to the upside with the Labor market saying that 261k jobs were added, as the unemployment rate rose to 3.7%. Traders viewed today’s numbers as a mixed picture, yet the idea that a cooldown in the Labor market, with the economy not tanking, was seen as a positive. However, the addition of 261k jobs may also keep the Fed’s policy of continued rate hikes on schedule, thereby pushing the much hoped-for pause or pivot on the back burner.
For the week, the Nasdaq was the biggest loser, down around 6%, the S&P 500 gave back 2.6%, while the Dow fared the best with only a 1.5% loss. Tech stocks gagged some 8%, but energy was the winner with a 2.4% gain.
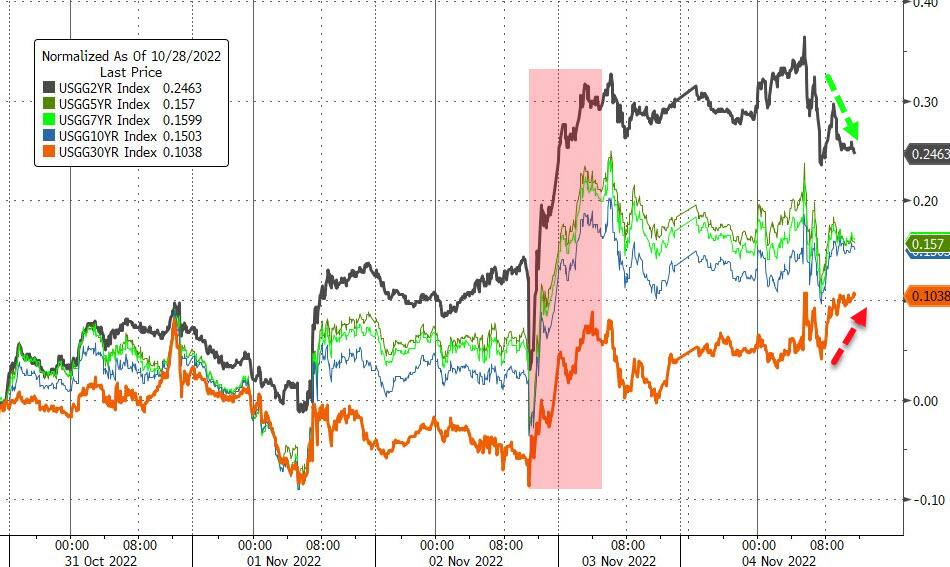
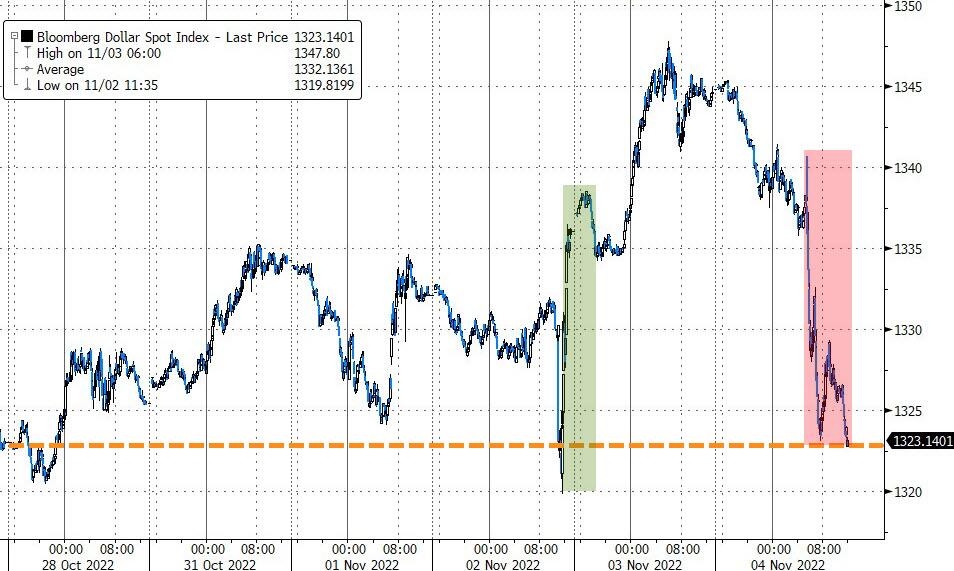
While bond yields had a mixed day, they stormed higher for the week with the 10-year solidly closing above its much-fought over 4% level (4.166%). The US Dollar took a massive dive today (almost 2%), but for the week the currency closed about unchanged.
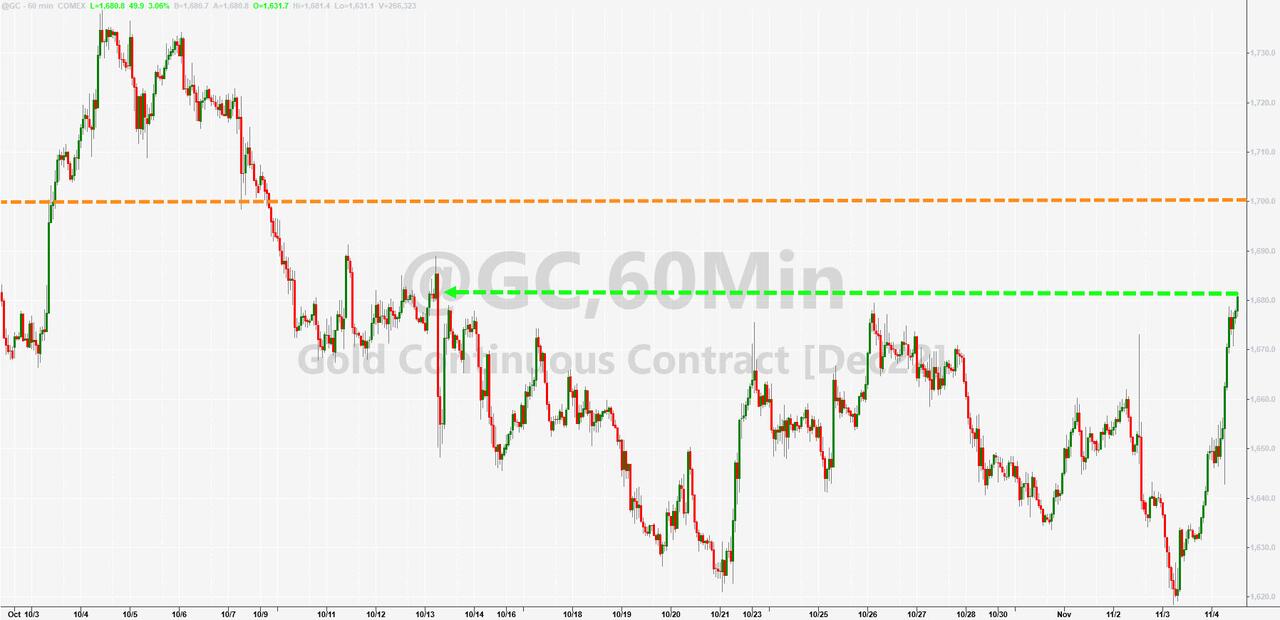
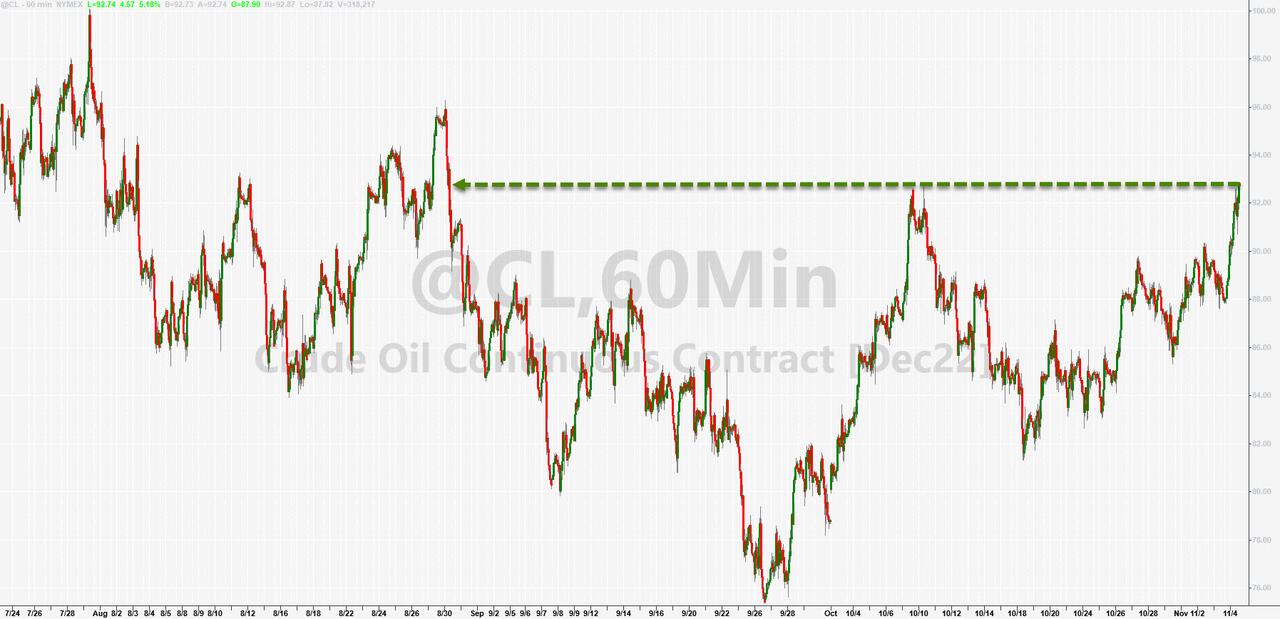
Gold benefitted, captured a solid +3.3% gain on the day and reached its highest point in 3 weeks, while Crude Oil followed suit but climbed to a 3-month high.
Fireworks could be on deck next week, as mid-term elections, and the latest CPI report, will both be able to affect future market direction.
2. ETFs in the Spotlight
In case you missed the announcement and description of this section, you can read it here again.
It features some of the 10 broadly diversified domestic and sector ETFs from my HighVolume list as posted every Saturday. Furthermore, they are screened for the lowest MaxDD% number meaning they have been showing better resistance to temporary sell offs than all others over the past year.
The below table simply demonstrates the magnitude with which these ETFs are fluctuating above or below their respective individual trend lines (%+/-M/A). A break below, represented by a negative number, shows weakness, while a break above, represented by a positive percentage, shows strength.
For hundreds of ETF choices, be sure to reference Thursday’s StatSheet.
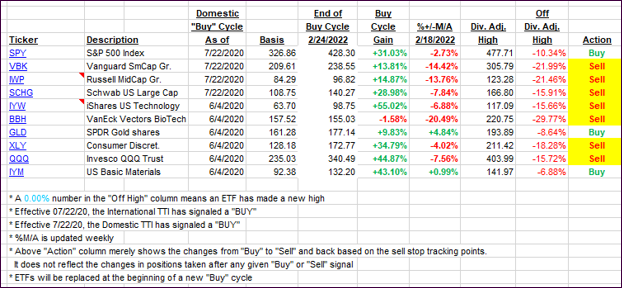
For this closed-out domestic “Buy” cycle (2/24/2022), here’s how some of our candidates have fared. Keep in mind that our Domestic Trend Tracking Index (TTI) signaled a “Sell” on that date, which overrode the existing “Buys” shown for SPY and IYM:
Click image to enlarge.
Again, the %+/-M/A column above shows the position of the various ETFs in relation to their respective long-term trend lines, while the trailing sell stops are being tracked in the “Off High” column. The “Action” column will signal a “Sell” once the -12% point has been taken out in the “Off High” column, which has replaced the prior -8% to -10% limits.
3. Trend Tracking Indexes (TTIs)
Our TTIs reversed direction and headed closer to their respective trend lines.
This is how we closed 11/04/2022:
Domestic TTI: -3.80% below its M/A (prior close -5.54%)—Sell signal effective 02/24/2022.
International TTI: -5.74% below its M/A (prior close -8.44%)—Sell signal effective 03/08/2022.
Disclosure: I am obliged to inform you that I, as well as my advisory clients, own some of the ETFs listed in the above table. Furthermore, they do not represent a specific investment recommendation for you, they merely show which ETFs from the universe I track are falling within the specified guidelines.
All linked charts above are courtesy of Bloomberg via ZeroHedge.
———————————————————-
WOULD YOU LIKE TO HAVE YOUR INVESTMENTS PROFESSIONALLY MANAGED?
Do you have the time to follow our investment plans yourself? If you are a busy professional who would like to have his portfolio managed using our methodology, please contact me directly to get more details.
Contact Ulli