
ETF Tracker StatSheet
You can view the latest version here.
WHEN BAD NEWS IS GOOD NEWS—AGAIN
- Moving the markets
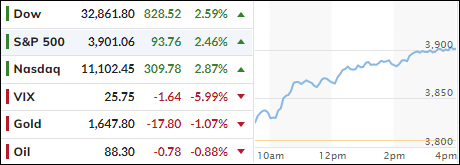
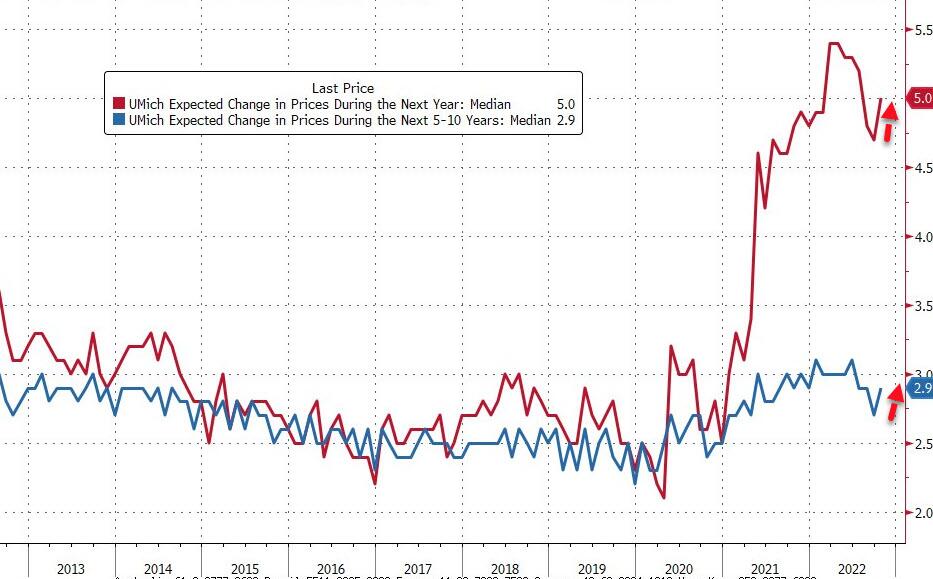
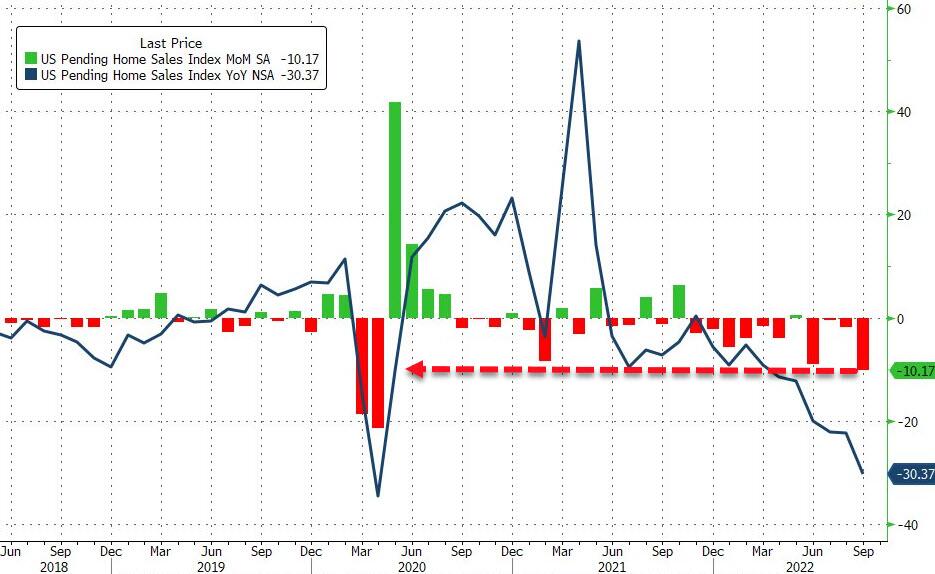
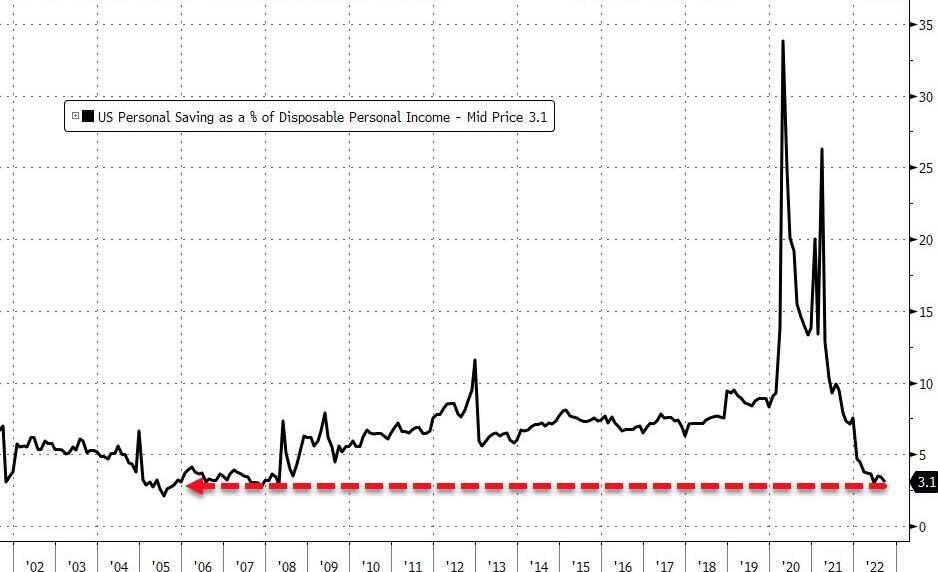
Looking at the tech wreck this week—during which heavyweights like Facebook and Amazon imploded, and the GDP allegedly grew by 2.6% in the 3rd quarter, while economic news was horrific, as inflation expectations jumped, US Pending Home Sales collapsed to their weakest since 2010, and the Americans’ Savings rate plunged to near record lows—you would have expected the markets to pull back in the face of such deteriorating economic conditions.
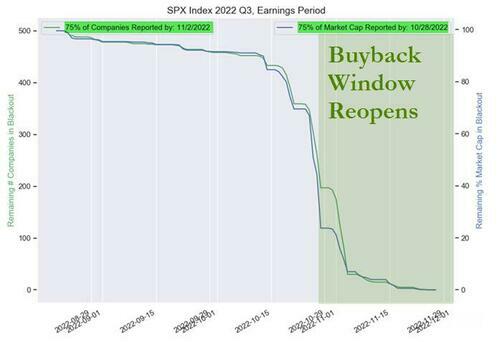
However, exactly the opposite occurred, as even the threat of nuclear war could not deter traders, algos and the corporate buy-back studs from ramping stocks higher, as October winds down with one more trading day to go.
Analyst MN Gordon of the EconomicPrism.com explained it this way as inflation, contrary to popular opinion, will continue to rear its ugly head:
The big Powell pivot that’s now being telegraphed for the December Federal Open Market Committee (FOMC) meeting has nothing to do with the arrival of a much-anticipated deceleration in the rate of inflation.
Nope, it’s all politics to juice the stock market in the runup to election day.
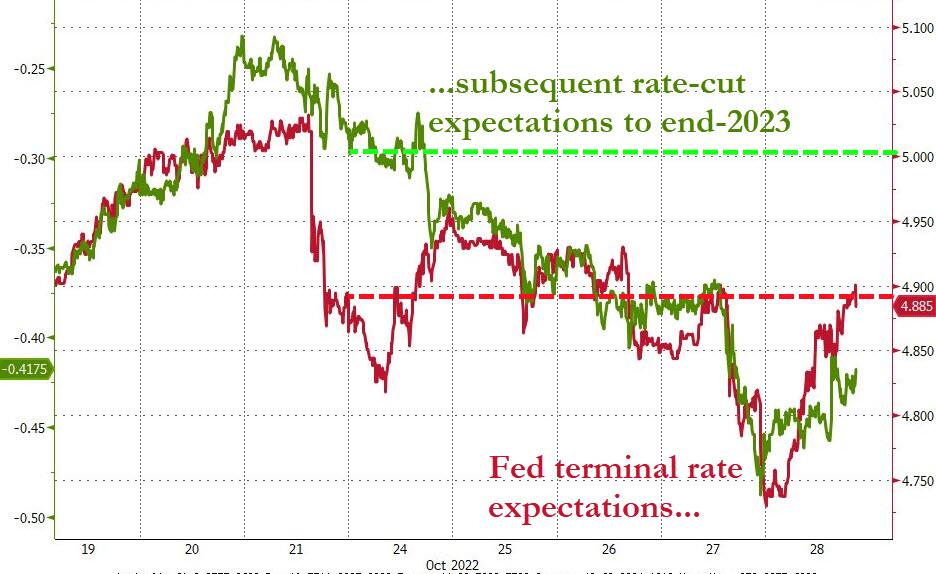
Given that, and the now much lower hoped for terminal rate expectations, as a potential Fed pivot is supposed to be imminent, I can see that the recognition, after the mid-term elections, that the inflation monster has not yet been brought under control, could provide the markets with another surprise, namely a “rug pull” that will collapse stocks again to new YTD lows.
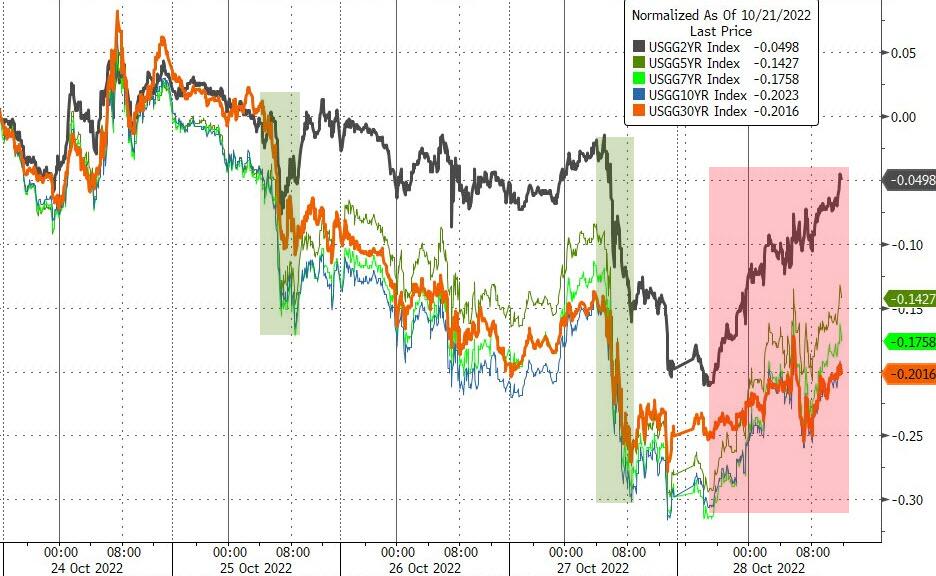
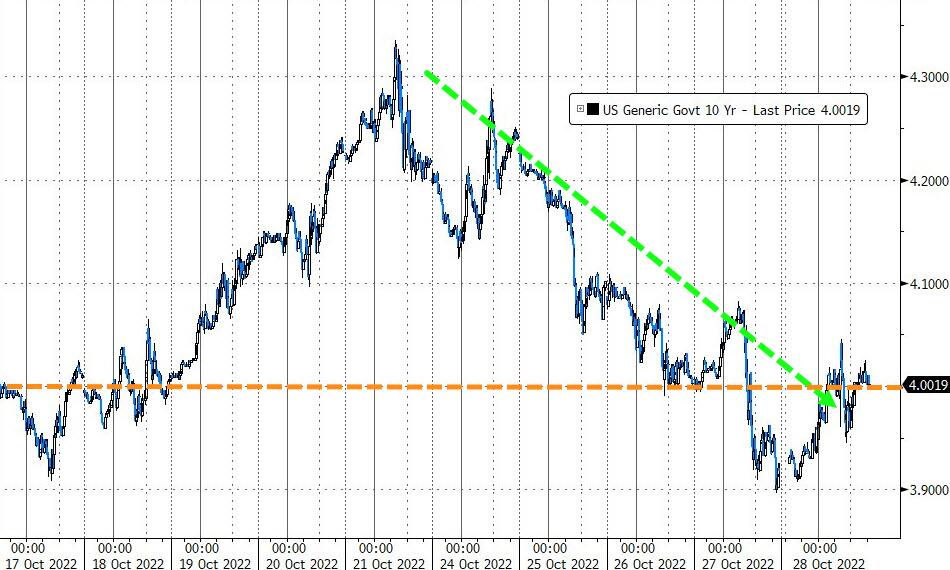
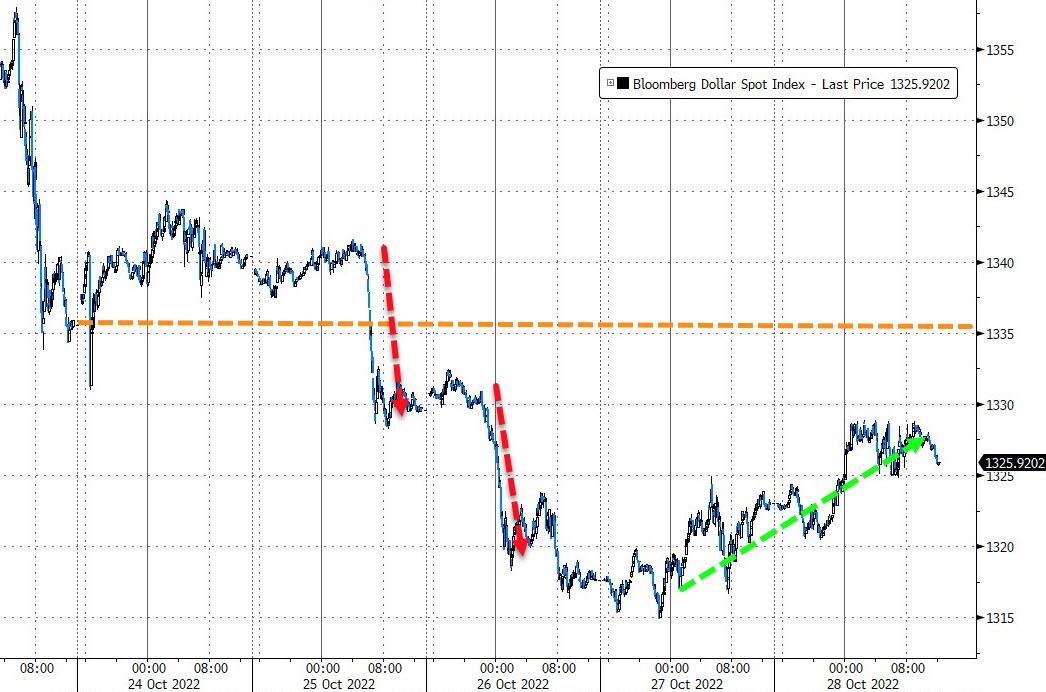
Bond yields popped for the day but were lower for the week, with the 10-year recovering its 4% level after having dropped below it yesterday. Despite recovering during the past two sessions, the US Dollar ended the week to the downside.
This upside charge in equities was not lost on my Trend Tracking Index (TTI-section 3), which surged this week and has now reached a point that is only -2.49% below its long-term trend line. Should this Ramp-A-Thon continue, we could find ourselves back in the market shortly.
Speaking against a robust upside continuation is the surprisingly so far spot-on historical analog to 2008/2009. Look at this chart, which may be more accurate than a 1,000 words.
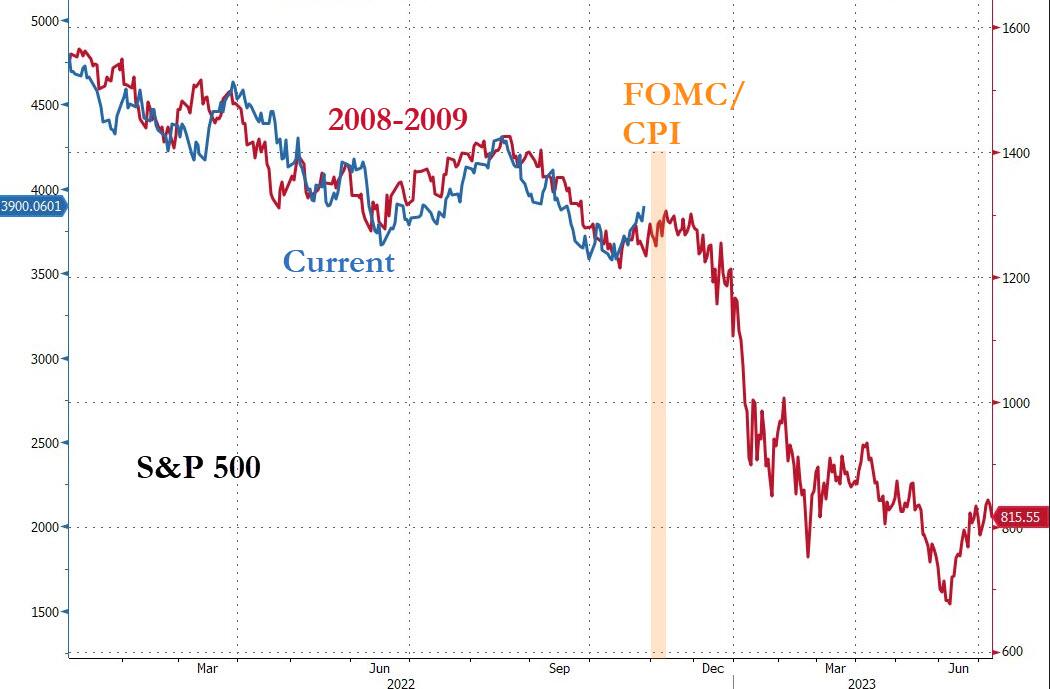
2. ETFs in the Spotlight
In case you missed the announcement and description of this section, you can read it here again.
It features some of the 10 broadly diversified domestic and sector ETFs from my HighVolume list as posted every Saturday. Furthermore, they are screened for the lowest MaxDD% number meaning they have been showing better resistance to temporary sell offs than all others over the past year.
The below table simply demonstrates the magnitude with which these ETFs are fluctuating above or below their respective individual trend lines (%+/-M/A). A break below, represented by a negative number, shows weakness, while a break above, represented by a positive percentage, shows strength.
For hundreds of ETF choices, be sure to reference Thursday’s StatSheet.
For this closed-out domestic “Buy” cycle (2/24/2022), here’s how some of our candidates have fared. Keep in mind that our Domestic Trend Tracking Index (TTI) signaled a “Sell” on that date, which overrode the existing “Buys” shown for SPY and IYM:
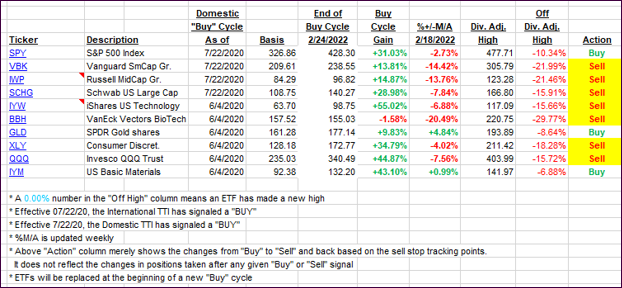
Click image to enlarge.
Again, the %+/-M/A column above shows the position of the various ETFs in relation to their respective long-term trend lines, while the trailing sell stops are being tracked in the “Off High” column. The “Action” column will signal a “Sell” once the -12% point has been taken out in the “Off High” column, which has replaced the prior -8% to -10% limits.
3. Trend Tracking Indexes (TTIs)
Our TTIs shot higher this week with the Domestic one moving to within striking distance of a new “Buy” signal.
This is how we closed 10/28/2022:
Domestic TTI: -2.49% below its M/A (prior close -4.67%)—Sell signal effective 02/24/2022.
International TTI: -7.17% below its M/A (prior close -8.47%)—Sell signal effective 03/08/2022.
Disclosure: I am obliged to inform you that I, as well as my advisory clients, own some of the ETFs listed in the above table. Furthermore, they do not represent a specific investment recommendation for you, they merely show which ETFs from the universe I track are falling within the specified guidelines.
All linked charts above are courtesy of Bloomberg via ZeroHedge.
———————————————————-
WOULD YOU LIKE TO HAVE YOUR INVESTMENTS PROFESSIONALLY MANAGED?
Do you have the time to follow our investment plans yourself? If you are a busy professional who would like to have his portfolio managed using our methodology, please contact me directly to get more details.
Contact Ulli