
- Moving the markets
Last week’s relentless hope that Fed head Powell will be forced to pivot due to recessionary forces (lower rates), which triggered a nice rebound, became questionable as to its timing and may not happen as quickly as the markets had expected. That could affect the duration of the current bullish run.
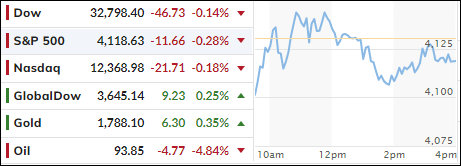
The major indexes slipped moderately after bouncing around their respective unchanged lines, as concerns reigned supreme about the Fed’s progress to stem the course of inflation.
As per ZeroHedge, three things changed today:
1) Jawboning – A smorgasbord of Fed (former and current) Speakers jawboned down the idea that a Fed Pivot is imminent.
2) Really Ugly Global Data – ISM Manufacturing data was bad and GDPNOW followed suit with a sizable downgrade of its Q3 growth forecast, (which followed terrible data out of China and EU)
3) WW3 Worries – Perhaps only of side notice, but Pelosi’s plan to visit Taiwan raises the risk of WW3 and that is just too bad of news to be buying.
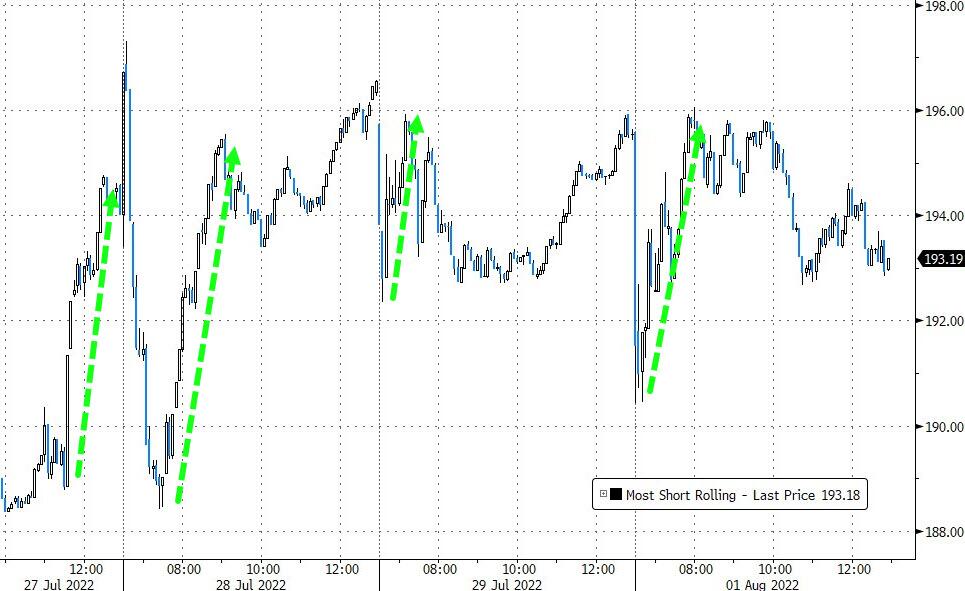
An opening short squeeze helped pull the major indexes out of the red zone, but the effort faded in the afternoon.
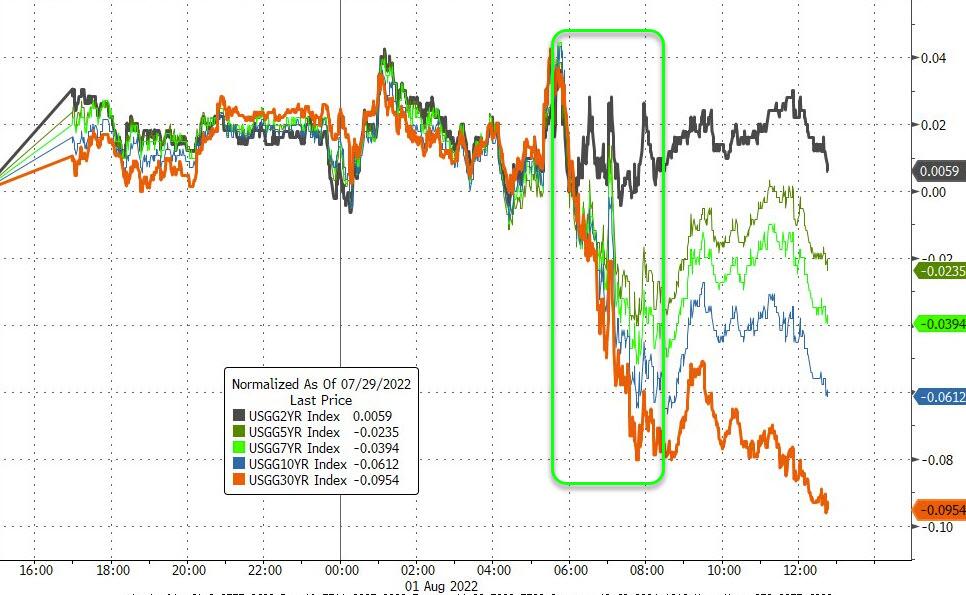
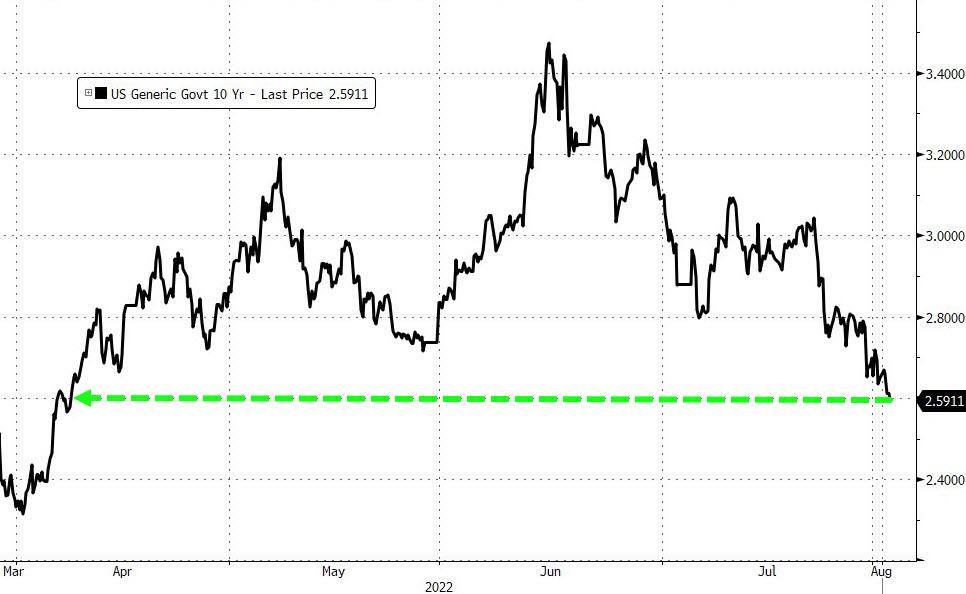
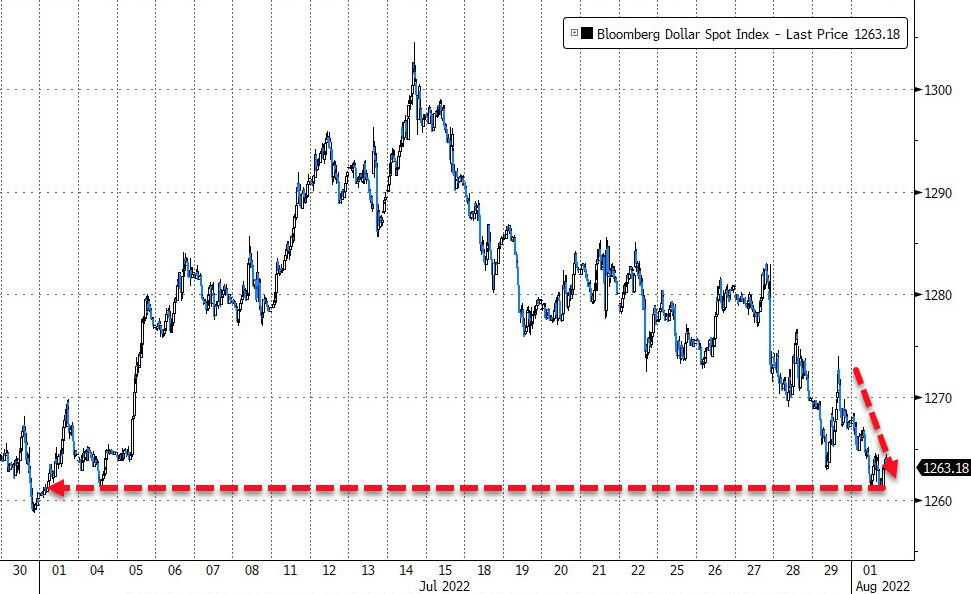
Bond yields were mixed, with the 10-year slipping to 2.59%, which was its lowest since the beginning of April. The US Dollar retreated as well and touched a 1-month low.
Gold continued jumping off its $1,700 level and is heading towards the $1,800 marker.
Market direction will remain headline news dependent with the July nonfarm payrolls report, due out later this week, being a decider as to whether some economists will continue to proclaim the “no recession” mantra. Strong jobs growth has led some to believe that we are not in one, despite two consecutive quarters of negative GDP.
2. ETFs in the Spotlight
In case you missed the announcement and description of this section, you can read it here again.
It features some of the 10 broadly diversified domestic and sector ETFs from my HighVolume list as posted every Saturday. Furthermore, they are screened for the lowest MaxDD% number meaning they have been showing better resistance to temporary sell offs than all others over the past year.
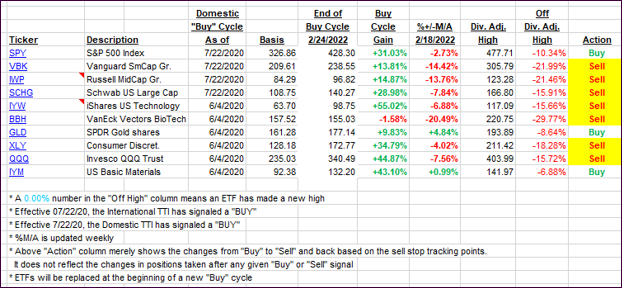
The below table simply demonstrates the magnitude with which these ETFs are fluctuating above or below their respective individual trend lines (%+/-M/A). A break below, represented by a negative number, shows weakness, while a break above, represented by a positive percentage, shows strength.
For hundreds of ETF choices, be sure to reference Thursday’s StatSheet.
For this closed-out domestic “Buy” cycle (2/24/2022), here’s how some of our candidates have fared. Keep in mind that our Domestic Trend Tracking Index (TTI) signaled a “Sell” on that date, which overrode the existing “Buys” shown for SPY and IYM:
Click image to enlarge.
Again, the %+/-M/A column above shows the position of the various ETFs in relation to their respective long-term trend lines, while the trailing sell stops are being tracked in the “Off High” column. The “Action” column will signal a “Sell” once the -12% point has been taken out in the “Off High” column, which has replaced the prior -8% to -10% limits.
3. Trend Tracking Indexes (TTIs)
Our TTIs barely changed, as the major indexes more or less trod water.
This is how we closed 08/01/2022:
Domestic TTI: -3.20% below its M/A (prior close -3.01%)—Sell signal effective 02/24/2022.
International TTI: -7.32% below its M/A (prior close -7.47%)—Sell signal effective 03/08/2022.
Disclosure: I am obliged to inform you that I, as well as my advisory clients, own some of the ETFs listed in the above table. Furthermore, they do not represent a specific investment recommendation for you, they merely show which ETFs from the universe I track are falling within the specified guidelines.
All linked charts above are courtesy of Bloomberg via ZeroHedge.
Contact Ulli