
ETF Tracker StatSheet
You can view the latest version here.
MAKING UP JUNE’S LOSSES
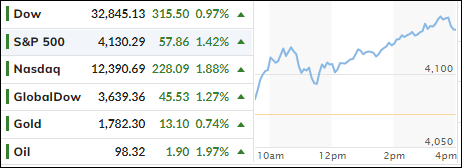
- Moving the markets
Despite the Fed’s rate hike of 75 bps on Wednesday and yesterday’s Q2 negative GDP print of -0.9%, the markets perceived all of it as a positive, never mind the fact that two consecutive negative GDP readings are and have been an indicator for the last 50 years that we have dropped into a recessionary economic environment.
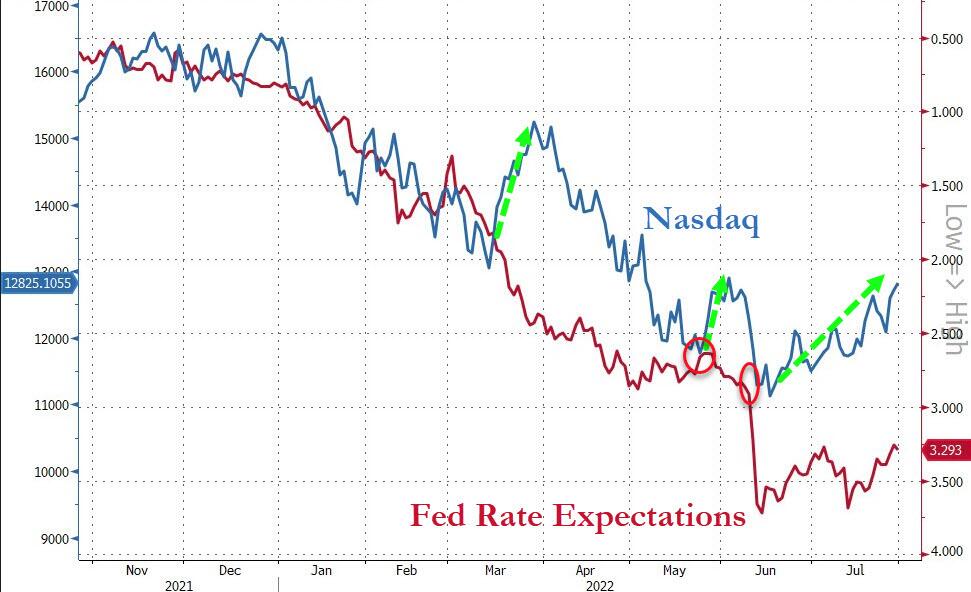
But those bad news were seen as good news, mainly due to Fed chief Powell leaving the door open that any future rate increases may be of a lesser magnitude. Analysts were quick to point out as that statement being the much-awaited Fed pivot, meaning potentially lower rates and, as a result, a resumption of the bull market.
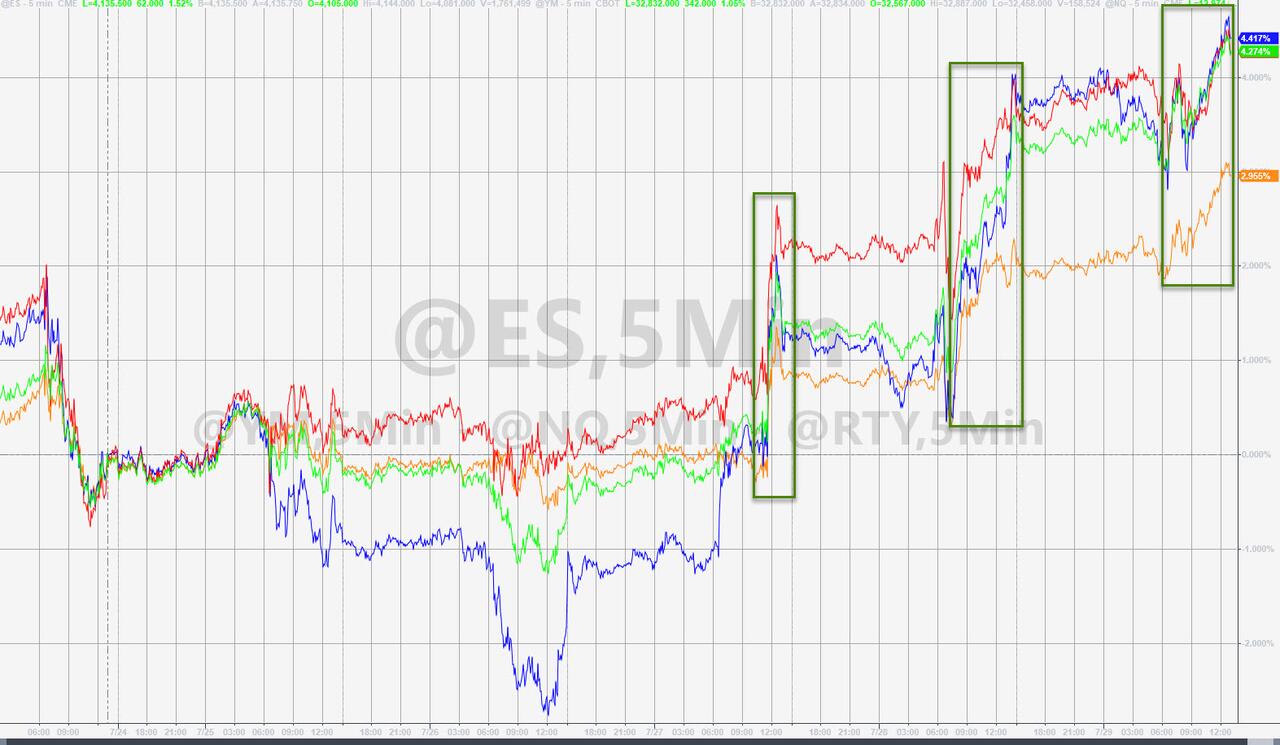
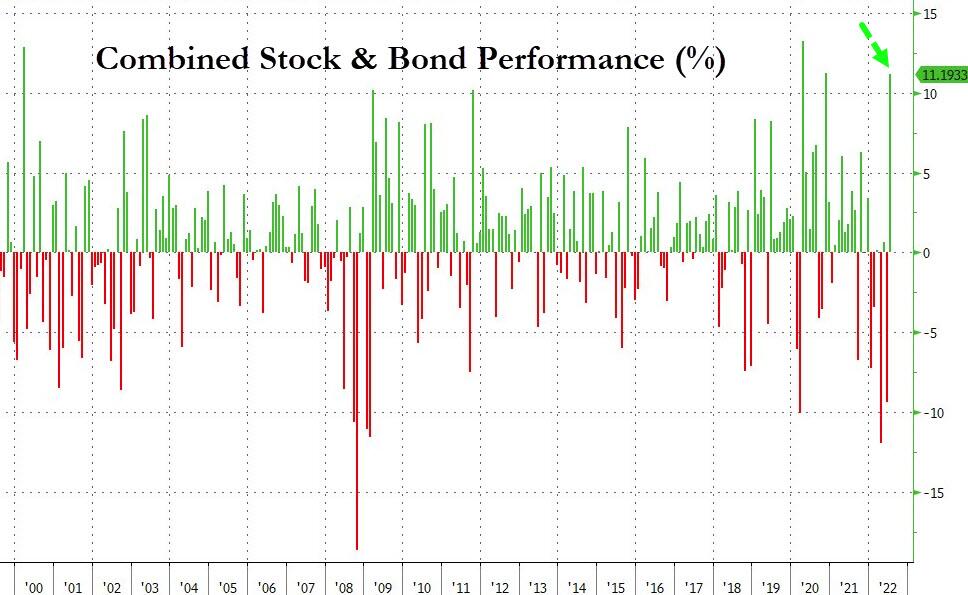
Consequently, we witnessed 3 days of front running in anticipation of that future change in policy by the Fed. For sure, the buy-and-hold crowd was happy, as the month of July produced a 9.1% gain for the S&P 500, thereby recapturing the losses sustained in June. With bond yields sliding, the combination stock/bond portfolio finally performed positively after getting spanked all year.
While this was certainly a step in the right direction, YTD the S&P 500 is still down -14.50%, but July turned out to be the best month for the major averages since November 2020.
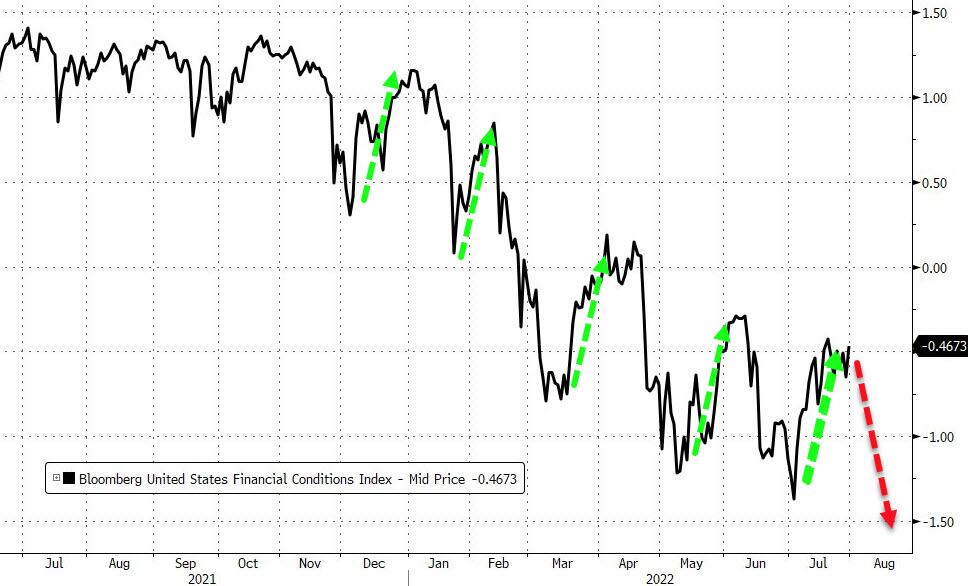
While our Trend Tracking Indexes (TTIs-section 3 below) greatly improved, they remain on the bearish side of their respective trend lines, however, a few more days of upward momentum may change their direction back to bullish and will allow us to consider exposure in domestic equities again.
Still, looking past this “bad news is good news” scenario, reality could still throw a monkey wrench into this emerging trend. Inflation remains worrisome and, if Fed head Powell does not pivot, as has happened before, but instead decides to get more serious with his inflation fighting effort via more rate hikes, you can kiss this rebound rally goodbye.
On the economic front, MarketWatch posted this:
Today, the Bureau of Economic Analysis reported that June’s personal consumption index climbed 6.8% on a 12-month basis. This inflation indicator, which is watched closely by the Fed, hit its highest level since January 1982.
In the end, this may prove to be still a bear market rally, although a powerful one, and we need more time to see if that’s the case, or if a new bull market can indeed sustain itself on nothing else but ‘Powell-Pivot’ hope, as ZeroHedge called it.
Hmm…
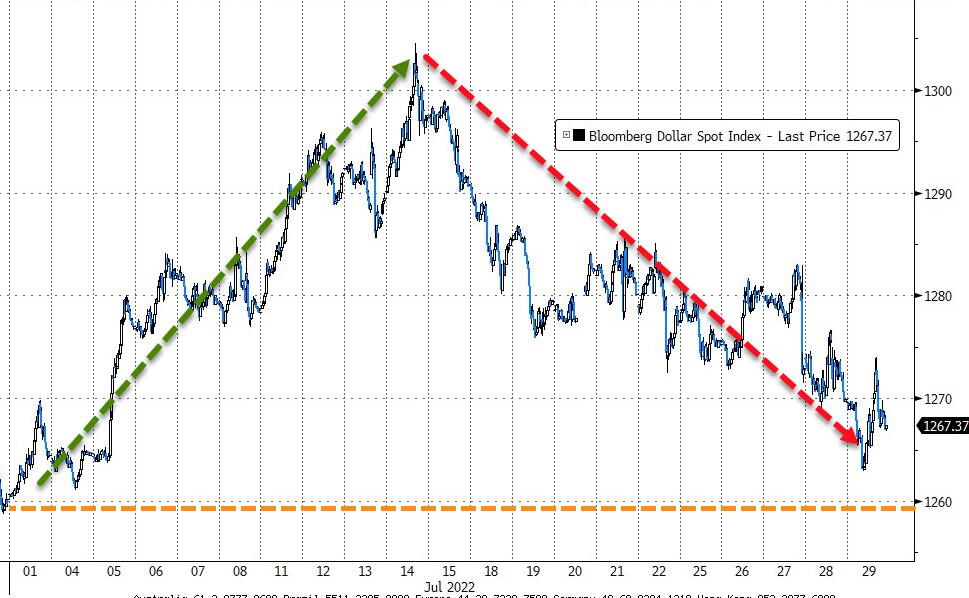
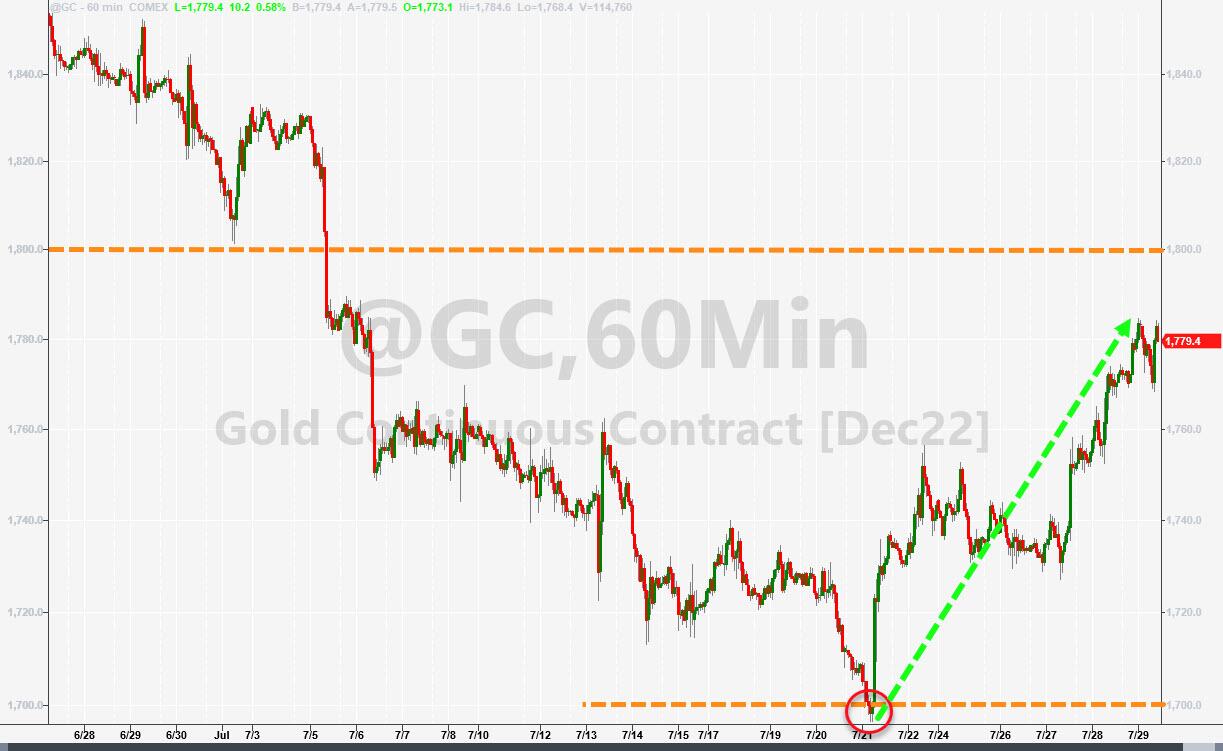
The US Dollar roundtripped and only ended marginally higher for the month. Gold, with the help of a sinking dollar and sliding interest rates, made some headway but was not able to recapture all its early losses.
ZeroHedge summed up the potential Powell pivot like this:
The trouble for ‘bad news is good news’ dip-buyers is simple – it’s path-dependent! You have to cross the tightening cycle Rubicon into recession before The Fed will step back in and save the world. How many of these dip-buyers have the stones to face that path?
Yes, how many indeed will have that fortitude?
2. ETFs in the Spotlight
In case you missed the announcement and description of this section, you can read it here again.
It features some of the 10 broadly diversified domestic and sector ETFs from my HighVolume list as posted every Saturday. Furthermore, they are screened for the lowest MaxDD% number meaning they have been showing better resistance to temporary sell offs than all others over the past year.
The below table simply demonstrates the magnitude with which these ETFs are fluctuating above or below their respective individual trend lines (%+/-M/A). A break below, represented by a negative number, shows weakness, while a break above, represented by a positive percentage, shows strength.
For hundreds of ETF choices, be sure to reference Thursday’s StatSheet.
For this closed-out domestic “Buy” cycle (2/24/2022), here’s how some of our candidates have fared. Keep in mind that our Domestic Trend Tracking Index (TTI) signaled a “Sell” on that date, which overrode the existing “Buys” shown for SPY and IYM:
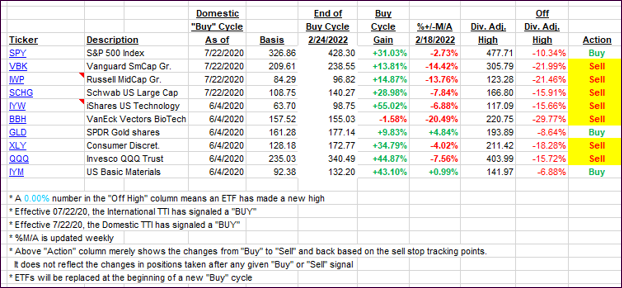
Click image to enlarge.
Again, the %+/-M/A column above shows the position of the various ETFs in relation to their respective long-term trend lines, while the trailing sell stops are being tracked in the “Off High” column. The “Action” column will signal a “Sell” once the -12% point has been taken out in the “Off High” column, which has replaced the prior -8% to -10% limits.
3. Trend Tracking Indexes (TTIs)
Our TTIs made big strides the past 3 days towards a potential crossing into bullish territory. If this does not turn into another head fake, we may find ourselves looking for exposure in domestic equities real soon.
This is how we closed 07/29/2022:
Domestic TTI: -3.01% below its M/A (prior close -4.03%)—Sell signal effective 02/24/2022.
International TTI: -7.47% below its M/A (prior close -8.76%)—Sell signal effective 03/08/2022.
Disclosure: I am obliged to inform you that I, as well as my advisory clients, own some of the ETFs listed in the above table. Furthermore, they do not represent a specific investment recommendation for you, they merely show which ETFs from the universe I track are falling within the specified guidelines.
All linked charts above are courtesy of Bloomberg via ZeroHedge.
———————————————————-
WOULD YOU LIKE TO HAVE YOUR INVESTMENTS PROFESSIONALLY MANAGED?
Do you have the time to follow our investment plans yourself? If you are a busy professional who would like to have his portfolio managed using our methodology, please contact me directly to get more details.
Contact Ulli