- Moving the markets
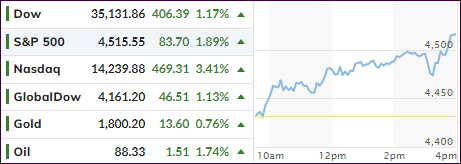
It seemed like traders and computer algos alike tried to mitigate the poor results of a dismal month by pumping the major indexes during the last two sessions with support from month-end rebalancing.
For sure, some losses were cut, but the major indexes still suffered a beating with the Dow faring the best by only surrendering -3.3% as opposed to the S&P 500’s -5.3% and the Nasdaq’s -8.9%, its worst month since March 2020.
The Nasdaq is still in correction territory, 13% off its high, while the S&P 500 has dipped below this 10% threshold but recovered to currently being off its high by only 7%.
High volatility and huge volumes combined with panic selling and panic buying has now created an environment, whose direction is still in doubt. That is further emphasized by the big boys on Wall Street, some of which hold diametrically opposed opinions. For example, JP Morgan opined that “We Go Higher,” while Morgan Stanley counters “Sell Rallies.”
This total uncertainty has been reflected by the behavior of our Domestic Trend Tracking Index (TTI), which has chopped above and below its dividing line between bullish and bearish territory. After hanging around in negative territory for a few days, the index managed today to crawl back above it (section 3 below), as the bulls found some month-end support.
Now that January is over, I would not be surprised to see a resumption of the recent sell off, as none of its causes have been rectified, and this 2-day ramp merely represented a bounce from an oversold position and the effects of rebalancing.
Nevertheless, should this rebound continue, we will cautiously add the appropriate equity positions back into our portfolios.
2. ETFs in the Spotlight
In case you missed the announcement and description of this section, you can read it here again.
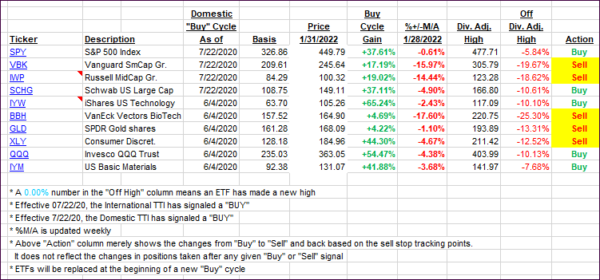
It features some of the 10 broadly diversified domestic and sector ETFs from my HighVolume list as posted every Saturday. Furthermore, they are screened for the lowest MaxDD% number meaning they have been showing better resistance to temporary sell offs than all others over the past year.
The below table simply demonstrates the magnitude with which these ETFs are fluctuating above or below their respective individual trend lines (%+/-M/A). A break below, represented by a negative number, shows weakness, while a break above, represented by a positive percentage, shows strength.
For hundreds of ETF choices, be sure to reference Thursday’s StatSheet.
For this current domestic “Buy” cycle, here’s how some of our candidates have fared:

Click image to enlarge.
Again, the %+/-M/A column above shows the position of the various ETFs in relation to their respective long-term trend lines, while the trailing sell stops are being tracked in the “Off High” column. The “Action” column will signal a “Sell” once the -12% point has been taken out in the “Off High” column, which has replaced the prior -8% to -10% limits.
3. Trend Tracking Indexes (TTIs)
Our TTIs joined the rebound with the Domestic one now closing back above its long-term trendline. Again, we are still in neutral territory, which means it would only take a small correction, and this index will sink again below its line and into bear market territory.
More upside momentum, along with staying power above the line, will have to happen for us to get back into the equity market.
This is how we closed 01/31/2022:
Domestic TTI: +0.95 above its M/A (prior close -0.55%)—Buy signal effective 07/22/2020.
International TTI: +1.39% above its M/A (prior close +1.39%)—Buy signal effective 07/22/2020.
Disclosure: I am obliged to inform you that I, as well as my advisory clients, own some of the ETFs listed in the above table. Furthermore, they do not represent a specific investment recommendation for you, they merely show which ETFs from the universe I track are falling within the specified guidelines.
All linked charts above are courtesy of Bloomberg via ZeroHedge.
Contact Ulli