
ETF Tracker StatSheet
You can view the latest version here.
DIRECTIONLESS WAVERING
- Moving the markets
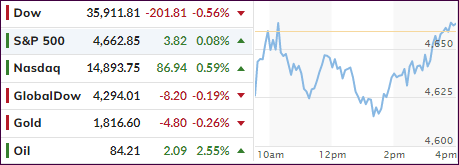
Other than during two strong up days, namely Tuesday and Wednesday, the markets meandered aimlessly and ended the week with a loss, although a modest one, with the S&P 500 surrendering 0.30%.
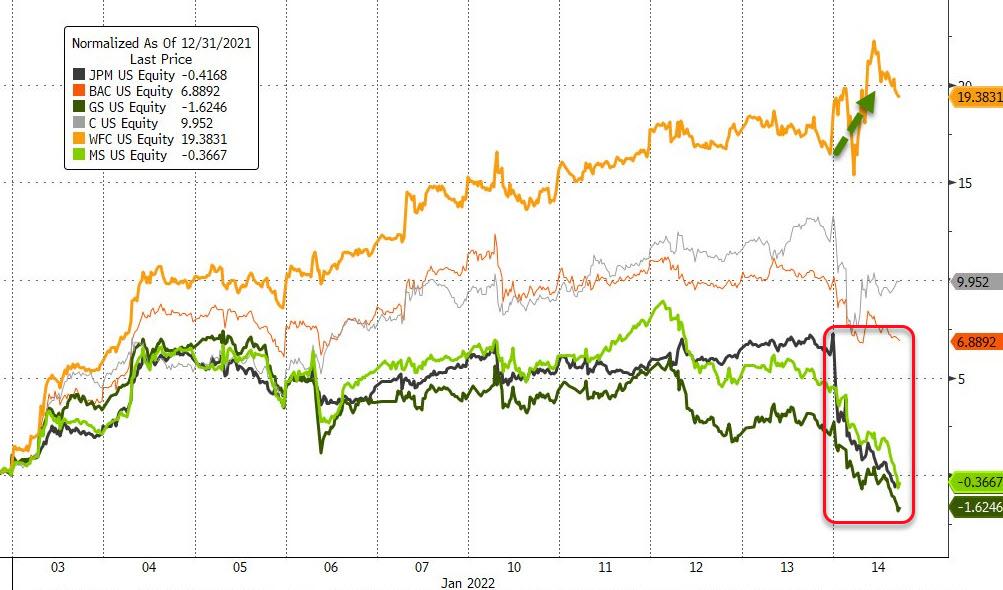
Despite expectations to the contrary, the earnings season for the big banks started on a negative, even though their stocks had been in rally mode during the past few weeks as interest rates rose. Earnings were simply underwhelming causing stock prices to give back some of the recent gains.
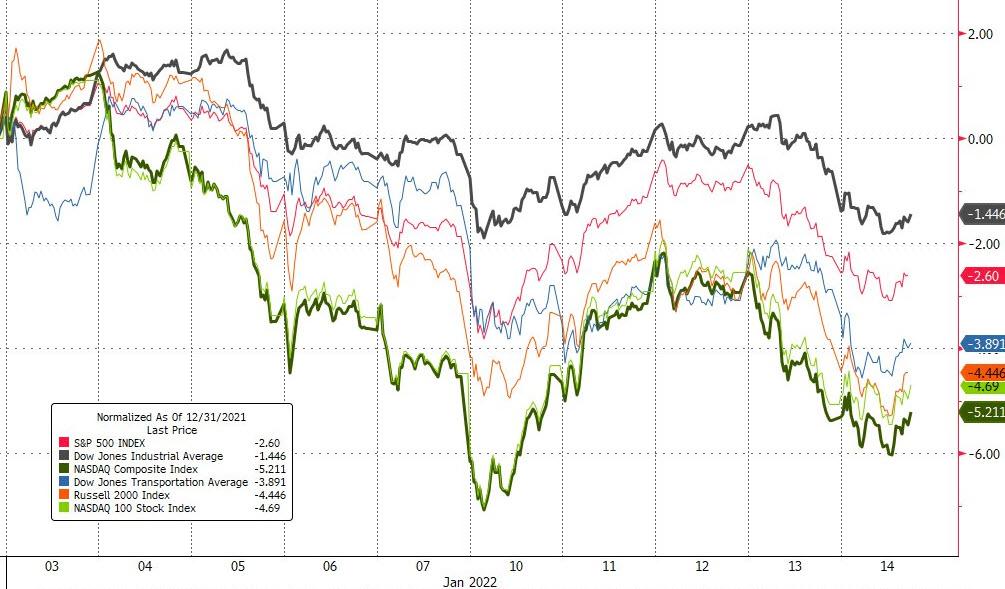
The major indexes were mixed, but the tech sector showed some signs of life after the recent drubbing, as the Nasdaq added 0.59% for the session. However, the YTD story is that all three of them are lower with the Nasdaq faring the worst. As ZH pointed out, in the last 30 years, only 2009 saw a worse start to the year for the tech arena.
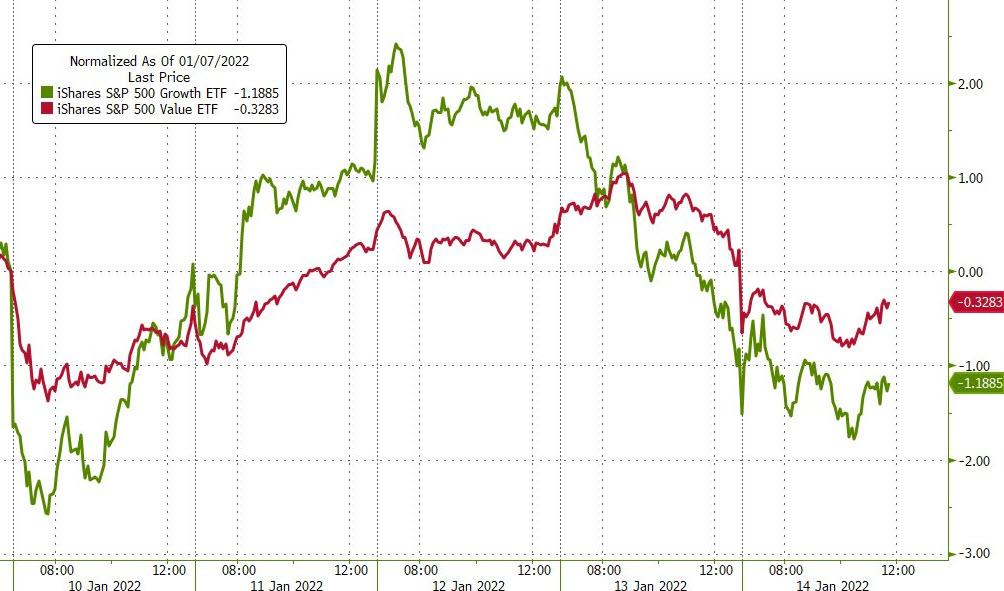
The most shorted stocks were squeezed halfway through the session thereby contributing to the late day rebound attempt. Growth and Value resumed their tug-of-war with Value coming out ahead in this endless battle for supremacy.
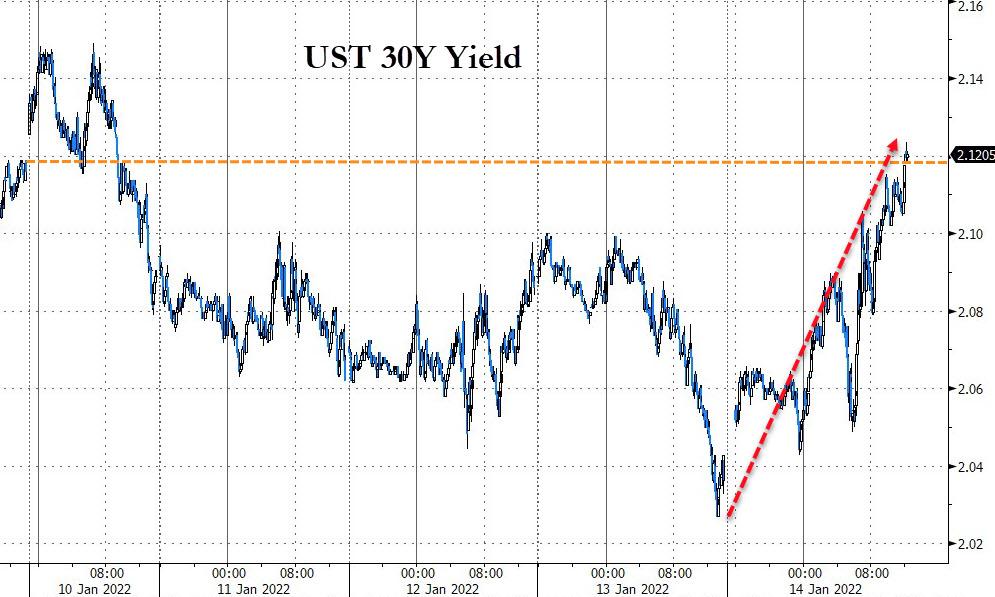
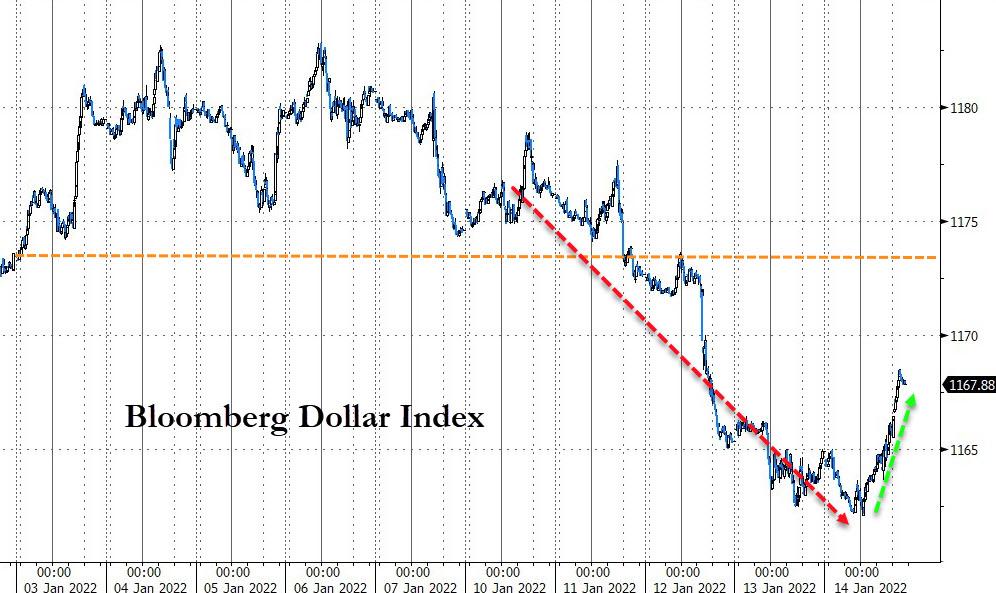
Bond yields were in a world of their own, while the 30-year staged a rebound today to get back to where it started the week. The US Dollar did not follow suit and slipped the past five days, and even a late session attempt could not break the downward trend.
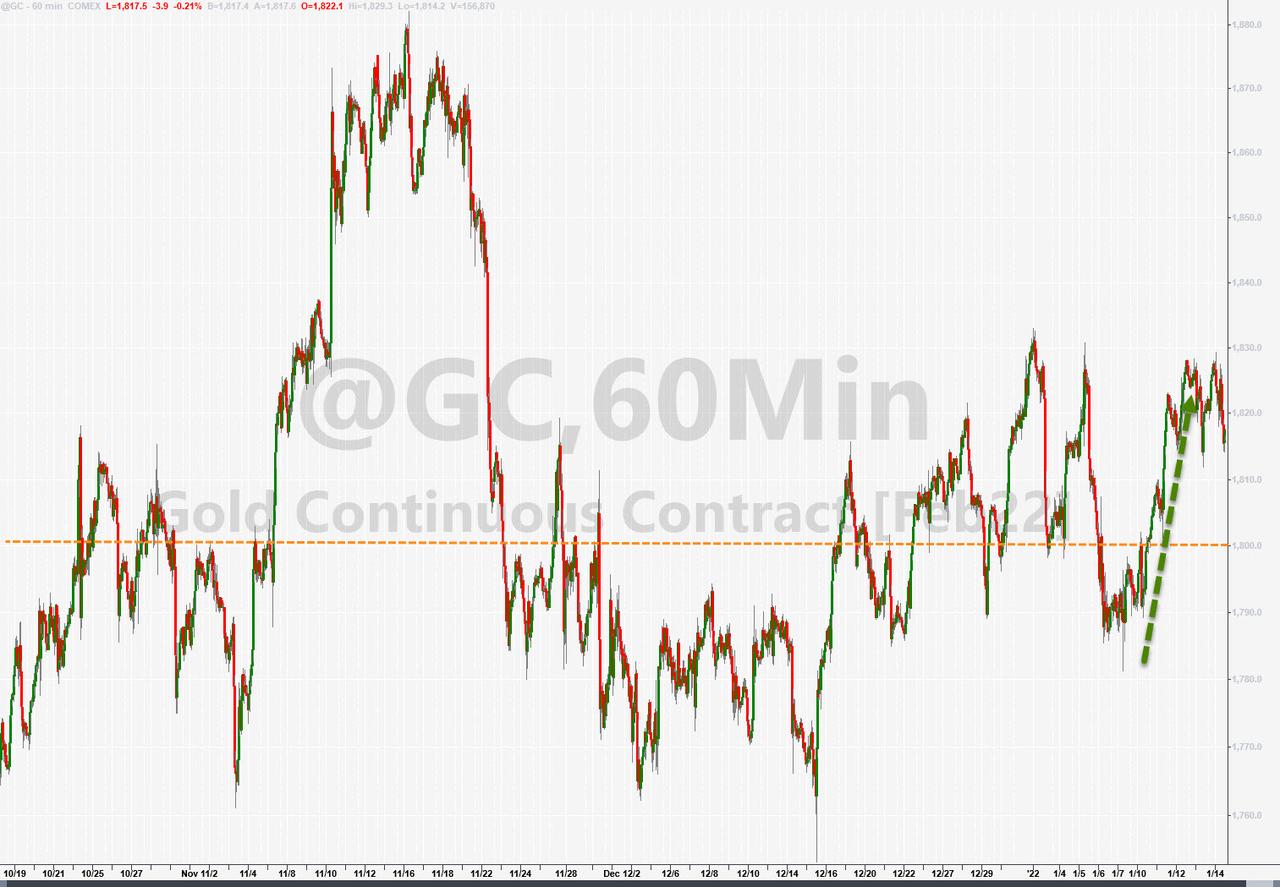
Gold finally showed some staying power and gained the last four weeks out of five and had its biggest week in 2 months, as ZH called it.
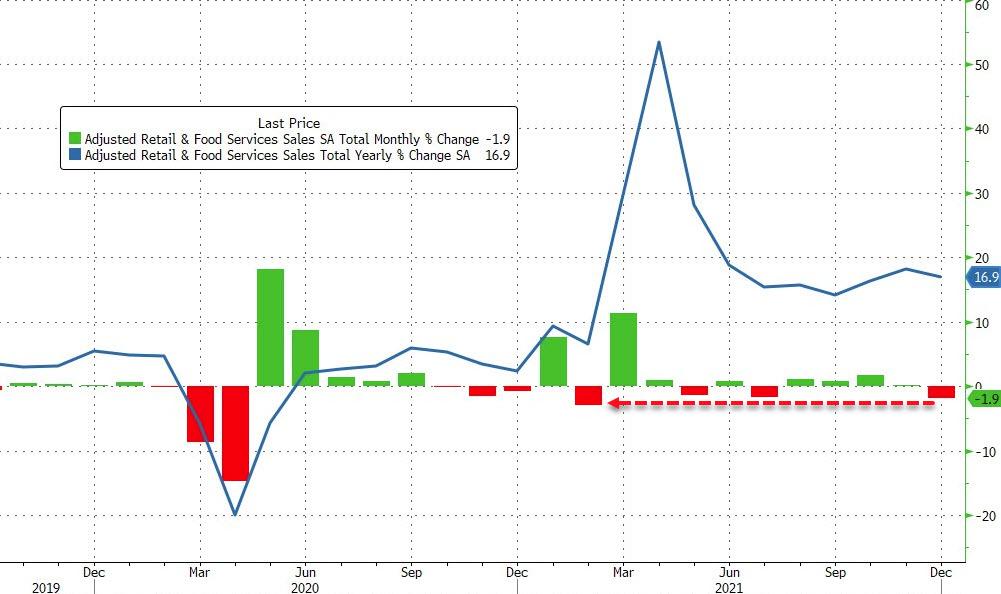
On the economic side, it was disappointing to learn that US Retail Sales plunged the most since February, while Industrial Production unexpectedly shrunk in December.
None of these numbers induce a warm and fuzzy feeling and, when combined with the Fed’s more hawkish approach to inflation, while we are in what I consider is a barely expanding economy, it’s no wonder that traders have more questions than answers. The result will be more volatility, as we work our way through this process of change.
The markets will be closed on Monday, Martin Luther King Holiday, so I will be back with the next commentary on Tuesday.
2. ETFs in the Spotlight
In case you missed the announcement and description of this section, you can read it here again.
It features some of the 10 broadly diversified domestic and sector ETFs from my HighVolume list as posted every Saturday. Furthermore, they are screened for the lowest MaxDD% number meaning they have been showing better resistance to temporary sell offs than all others over the past year.
The below table simply demonstrates the magnitude with which these ETFs are fluctuating above or below their respective individual trend lines (%+/-M/A). A break below, represented by a negative number, shows weakness, while a break above, represented by a positive percentage, shows strength.
For hundreds of ETF choices, be sure to reference Thursday’s StatSheet.
For this current domestic “Buy” cycle, here’s how some of our candidates have fared:
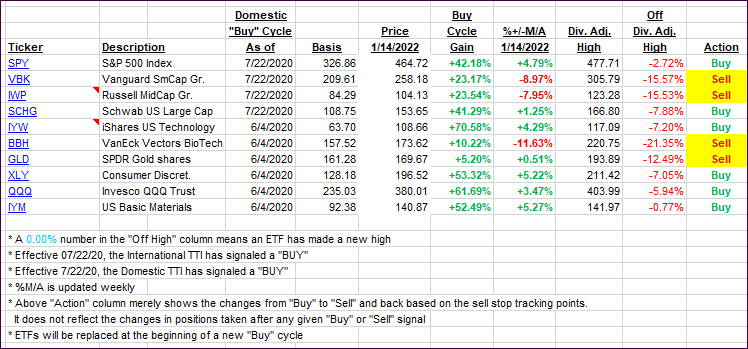
Click image to enlarge.
Again, the %+/-M/A column above shows the position of the various ETFs in relation to their respective long-term trend lines, while the trailing sell stops are being tracked in the “Off High” column. The “Action” column will signal a “Sell” once the -12% point has been taken out in the “Off High” column, which has replaced the prior -8% to -10% limits.
3. Trend Tracking Indexes (TTIs)
Our TTIs slipped as the major indexes bobbed and weaved.
This is how we closed 01/14/2022:
Domestic TTI: +5.07% above its M/A (prior close +5.33%)—Buy signal effective 07/22/2020.
International TTI: +6.13% above its M/A (prior close 6.33%)—Buy signal effective 07/22/2020.
Disclosure: I am obliged to inform you that I, as well as my advisory clients, own some of the ETFs listed in the above table. Furthermore, they do not represent a specific investment recommendation for you, they merely show which ETFs from the universe I track are falling within the specified guidelines.
All linked charts above are courtesy of Bloomberg via ZeroHedge.
———————————————————-
WOULD YOU LIKE TO HAVE YOUR INVESTMENTS PROFESSIONALLY MANAGED?
Do you have the time to follow our investment plans yourself? If you are a busy professional who would like to have his portfolio managed using our methodology, please contact me directly or get more details here.
Contact Ulli