
ETF Tracker StatSheet
You can view the latest version here.
STORMING INTO OCTOBER
- Moving the markets
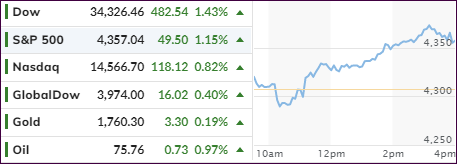
After a swan dive onto the last trading day of September, a month during which the S&P 500 surrendered almost 5%, October started with a bang, after some initial choppiness was overcome.
The major indexes found upward momentum and raced ahead in unison led by the Dow with a gain of 1.43%. Lagging the threesome was the Nasdaq, but it managed to put up a decent performance by advancing 0.82%.
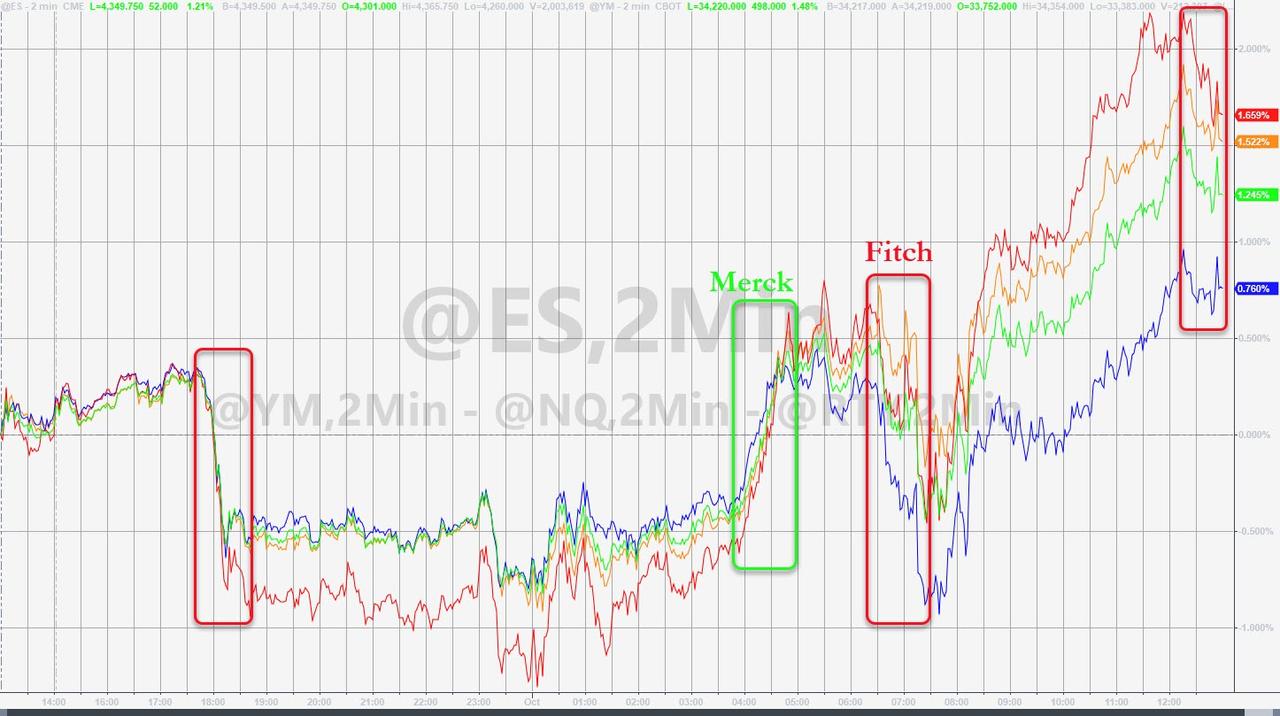
The primary supporting actor came in form of news about a new oral treatment for Covid 19, which boosted spirits and shares alike, with the latter ones being lifted due to exposure in those areas that benefit from the economic recovery.
Also helping the mood was the House’s passing of a short-term appropriations bill, which will keep the government running until December 3rd, however, the debt ceiling debacle is still on deck and will have to be dealt with.
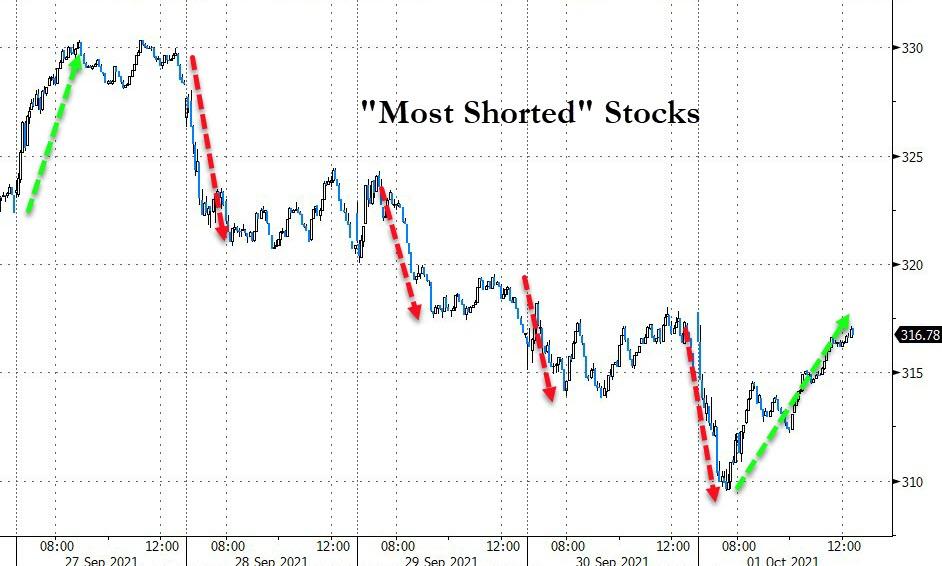
Today’s rebound could not mask the fact that this was an ugly week for equities. Most shorted stocks contributed to the selloff yet today, due to a squeeze, they helped the bounce back.
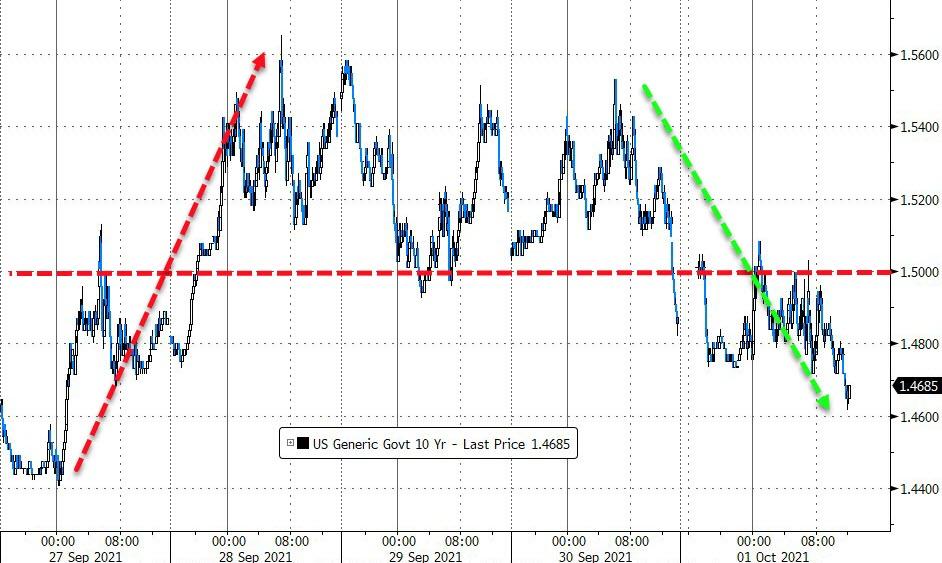
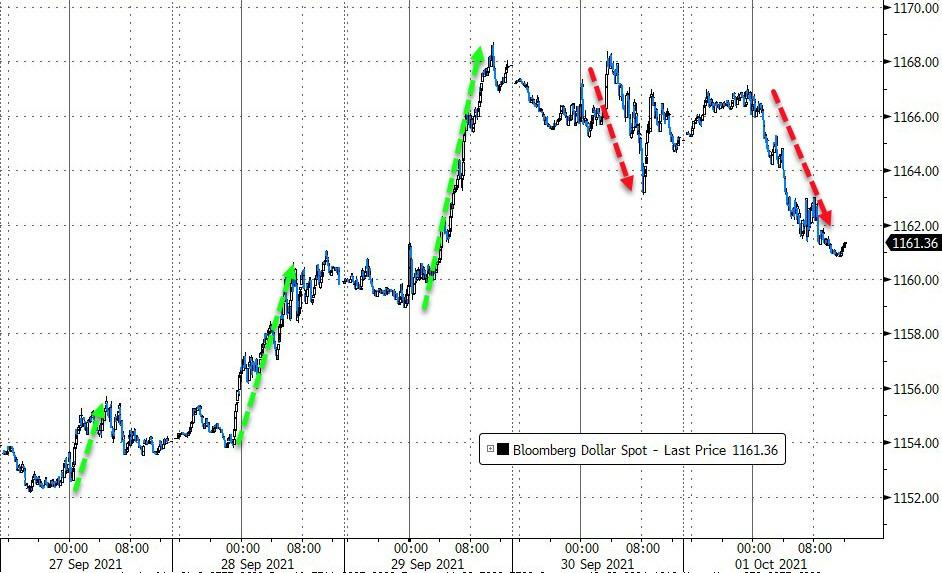
Bond yields pumped and dumped with the 10-year now back down to 1.47%, after having made a high of 1.56% only 3 days ago. The US Dollar ended the week higher, but off the high point set on Wednesday. That combination of yields dropping and the dollar retreating allowed gold to find some footing with the precious metal eking out a tiny gain of 0.19%.
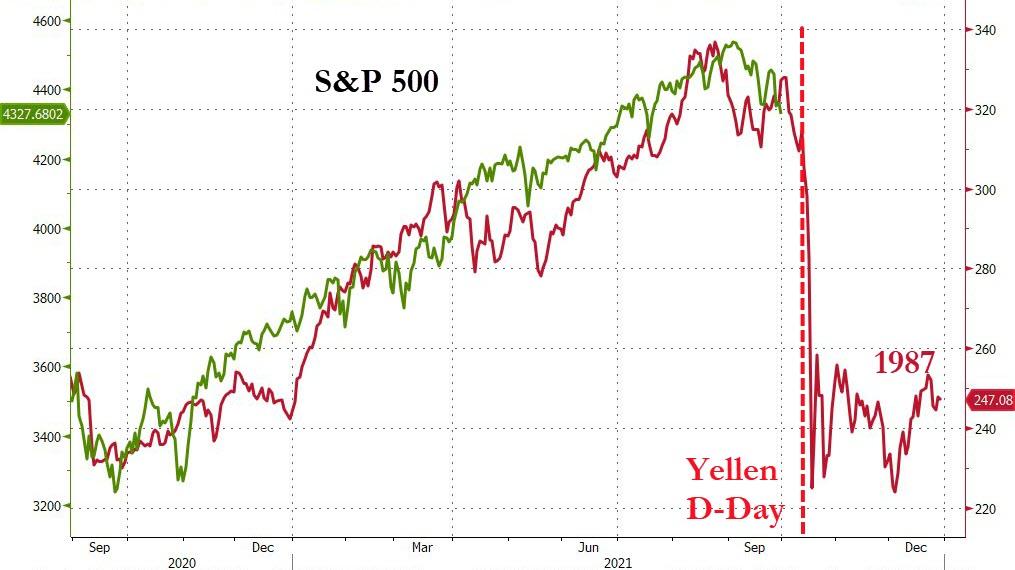
Leave it up to Bloomberg via ZeroHedge to post this updated analog chart which, at least as of this moment in time, appears to be uncanny in its comparison.
2. ETFs in the Spotlight
In case you missed the announcement and description of this section, you can read it here again.
It features some of the 10 broadly diversified domestic and sector ETFs from my HighVolume list as posted every Saturday. Furthermore, they are screened for the lowest MaxDD% number meaning they have been showing better resistance to temporary sell offs than all others over the past year.
The below table simply demonstrates the magnitude with which these ETFs are fluctuating above or below their respective individual trend lines (%+/-M/A). A break below, represented by a negative number, shows weakness, while a break above, represented by a positive percentage, shows strength.
For hundreds of ETF choices, be sure to reference Thursday’s StatSheet.
For this current domestic “Buy” cycle, here’s how some our candidates have fared:
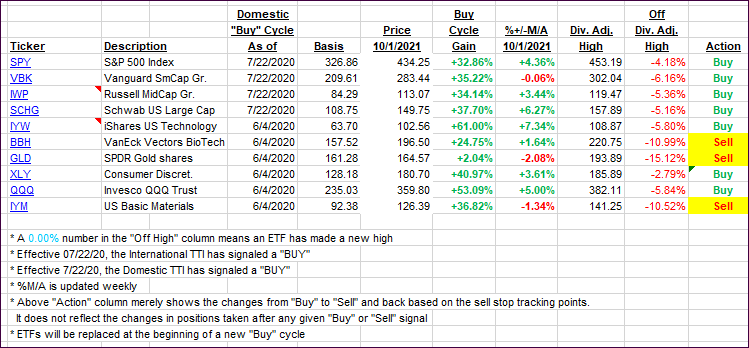
Click image to enlarge.
Again, the %+/-M/A column above shows the position of the various ETFs in relation to their respective long-term trend lines, while the trailing sell stops are being tracked in the “Off High” column. The “Action” column will signal a “Sell” once the -8% point has been taken out in the “Off High” column. For more volatile sector ETFs, the trigger point is -10%.
3. Trend Tracking Indexes (TTIs)
Our TTIs recovered from the sharp drop this week with the Domestic one showing more momentum.
This is how we closed 10/01/2021:
Domestic TTI: +4.51% above its M/A (prior close +3.59%)—Buy signal effective 07/22/2020.
International TTI: +1.79% above its M/A (prior close +1.72%)—Buy signal effective 07/22/2020.
Disclosure: I am obliged to inform you that I, as well as my advisory clients, own some of the ETFs listed in the above table. Furthermore, they do not represent a specific investment recommendation for you, they merely show which ETFs from the universe I track are falling within the specified guidelines.
All linked charts above are courtesy of Bloomberg via ZeroHedge.
———————————————————-
WOULD YOU LIKE TO HAVE YOUR INVESTMENTS PROFESSIONALLY MANAGED?
Do you have the time to follow our investment plans yourself? If you are a busy professional who would like to have his portfolio managed using our methodology, please contact me directly or get more details here.
Contact Ulli