- Moving the markets
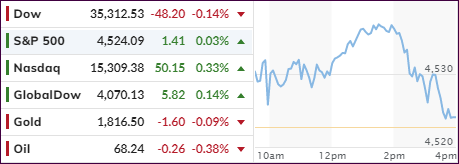
The markets stumbled into the first trading day of September with an early rally running out of steam, but the major indexes managed to stay close to their respective unchanged lines. The exception was the Nasdaq, which showed most of the staying power by not only remaining solidly in the green throughout the session but also hitting a new intraday all-time high.
In the end, it may have been ADP’s dismal private payroll numbers, which took the starch out of the early bounce.
ZeroHedge explained it this way:
For the second month in a row, the ADP Private Payroll employment report has been a complete disaster, and one month after the the ADP missed by almost half printing at 330K in June (missing expectations of 683K), ADP reported that private payrolls in August rose just 374K, which while a modest improvement from July’s downward revised 326K (which was the lowest since February), was again a huge miss to the 638K expected, and was in fact below the lowest forecast by polled economists (+400K).
That has traders on edge, because this report is a precursor to the official August non-farm payrolls data due out this Friday. Expectations are the creation of 720k new jobs along with a drop in the unemployment rate to 5.2%.
Some analysts are also concerned about a correction in September, which is historically the worst month of the year for equities. Additionally, stocks have not had a significant pullback since last October. However, given the Fed’s dovish attitude, who knows if history will repeat itself.
Bond yields took a dive early on, after the ADP report, yet bounced back with the 10-year ending at 1.3%. The US Dollar dropped moderately, and gold closed just about unchanged.
If Friday’s payroll report confirms that jobs growth is indeed slowing, this could have a negative effect on the economy, but a positive one the stock market.
Why?
It means that easy monetary policy will likely continue. In today’s twisted reality, that is how bad economic news becomes good news for the markets.
2. ETFs in the Spotlight
In case you missed the announcement and description of this section, you can 8 again.
It features some of the 10 broadly diversified domestic and sector ETFs from my HighVolume list as posted every Saturday. Furthermore, they are screened for the lowest MaxDD% number meaning they have been showing better resistance to temporary sell offs than all others over the past year.
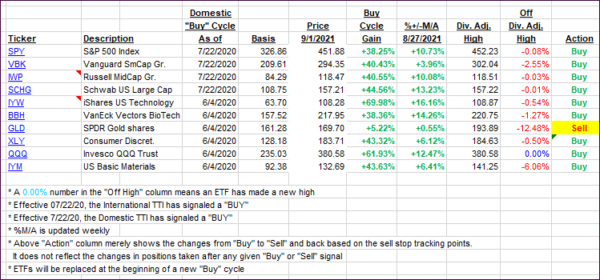
The below table simply demonstrates the magnitude with which these ETFs are fluctuating above or below their respective individual trend lines (%+/-M/A). A break below, represented by a negative number, shows weakness, while a break above, represented by a positive percentage, shows strength.
For hundreds of ETF choices, be sure to reference Thursday’s StatSheet.
For this current domestic “Buy” cycle, here’s how some our candidates have fared:

Click image to enlarge.
Again, the %+/-M/A column above shows the position of the various ETFs in relation to their respective long-term trend lines, while the trailing sell stops are being tracked in the “Off High” column. The “Action” column will signal a “Sell” once the -8% point has been taken out in the “Off High” column. For more volatile sector ETFs, the trigger point is -10%.
3. Trend Tracking Indexes (TTIs)
Our TTIs again changed only immaterially, as aimless meandering was the meme of the day.
This is how we closed 09/01/2021:
Domestic TTI: +9.98% above its M/A (prior close +9.95%)—Buy signal effective 07/22/2020.
International TTI: +6.17% above its M/A (prior close +6.00%)—Buy signals effective 07/22/2020.
Disclosure: I am obliged to inform you that I, as well as my advisory clients, own some of the ETFs listed in the above table. Furthermore, they do not represent a specific investment recommendation for you, they merely show which ETFs from the universe I track are falling within the specified guidelines.
All linked charts above are courtesy of Bloomberg via ZeroHedge.
Contact Ulli