- Moving the markets
An early purge in the markets was met with a subsequent surge, which propelled the major indexes back to their respective unchanged lines, but only the Nasdaq managed to score a green close.
Retail sales surprised by rising 0.7% MoM, which was exactly the opposite of expectation of a 0.8% MoM drop. Helping this enormous “beat” was a revision of the initial July estimate from a gain to a decline, which makes the validity of this current number questionable.
Meanwhile, the latest weekly unemployment insurance data revealed that 332k first-time claims were filed, a slightly worse number than the 320k expected.
Still, uncertainty about a host of issues affect the markets, which one analyst described like this:
The stress factors facing the market have not materially changed, including the Delta variant, earnings headwinds from supply chain and labor challenges, fiscal and monetary tailwind shifting to headwinds and bubbling concerns around China.
Dip buyers could not resist and got today’s rebound started assisted by another short squeeze, the combination of which wiped out most of the early losses.
The US Dollar Index spiked, as did Bond yields with the 10-year reaching the 1.33% level. As a result, as we’ve seen many times before, this double punch sent Gold reeling and back below its $1,800 level.
As Bloomberg shows in this chart, the S&P 500 seems to have gotten ahead of reality, namely the Fed’s balance sheet expansion, so a pullback would be in order. It could happen tomorrow during quadruple witching hour, when a huge number of options will expire, which is an event that can wreak havoc with the markets.
As a reminder, I will be out tomorrow, so there will be no market commentary. My regular posting schedule will resume on Monday.
Continue reading…
2. ETFs in the Spotlight
In case you missed the announcement and description of this section, you can read it here again.
It features some of the 10 broadly diversified domestic and sector ETFs from my HighVolume list as posted every Saturday. Furthermore, they are screened for the lowest MaxDD% number meaning they have been showing better resistance to temporary sell offs than all others over the past year.
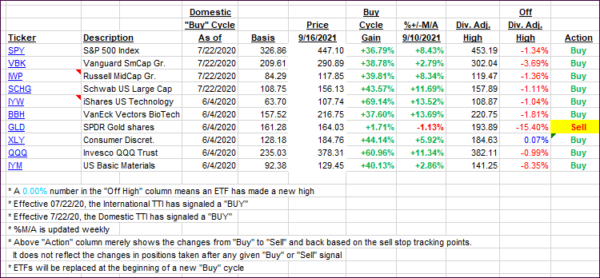
The below table simply demonstrates the magnitude with which these ETFs are fluctuating above or below their respective individual trend lines (%+/-M/A). A break below, represented by a negative number, shows weakness, while a break above, represented by a positive percentage, shows strength.
For hundreds of ETF choices, be sure to reference Thursday’s StatSheet.
For this current domestic “Buy” cycle, here’s how some our candidates have fared:

Click image to enlarge.
Again, the %+/-M/A column above shows the position of the various ETFs in relation to their respective long-term trend lines, while the trailing sell stops are being tracked in the “Off High” column. The “Action” column will signal a “Sell” once the -8% point has been taken out in the “Off High” column. For more volatile sector ETFs, the trigger point is -10%.
3. Trend Tracking Indexes (TTIs)
Our TTIs pulled back a tad, as the major indexes dug themselves out of an early hole.
This is how we closed 09/16/2021:
Domestic TTI: +7.45% above its M/A (prior close +7.65%)—Buy signal effective 07/22/2020.
International TTI: +4.52% above its M/A (prior close +4.89%)—Buy signals effective 07/22/2020.
Disclosure: I am obliged to inform you that I, as well as my advisory clients, own some of the ETFs listed in the above table. Furthermore, they do not represent a specific investment recommendation for you, they merely show which ETFs from the universe I track are falling within the specified guidelines.
All linked charts above are courtesy of Bloomberg via ZeroHedge.
Contact Ulli