
- Moving the markets
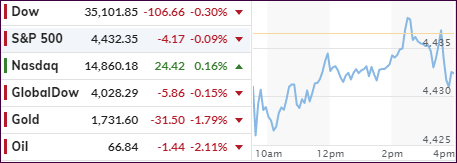
The growth meme was the talk of the day on Wall Street, as concerns mounted again that not all is well in the world of economics.
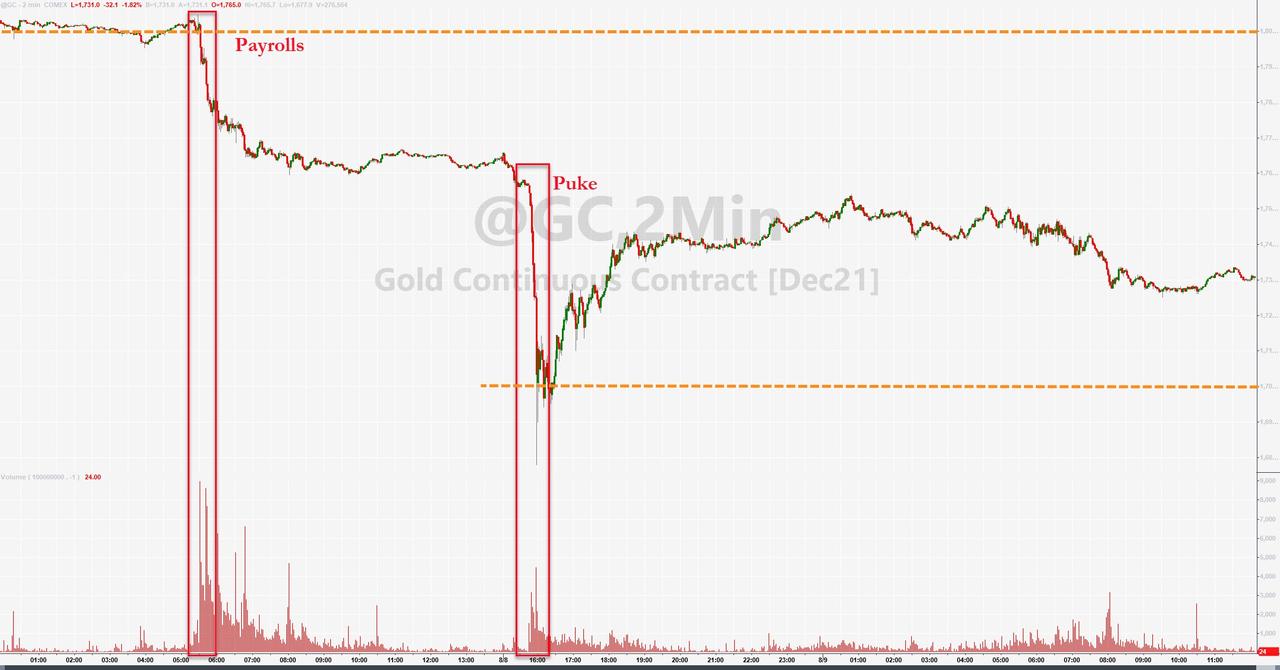
Things started on a shaky foundation in the futures markets, with all major indexes in the red, while gold got hammered almost 3%, as one entity unloaded $4 billion in gold contracts. This was obviously an act of manipulation because an investor concerned with not moving markets adversely would liquidate a holding slowly and meticulously and not dump it all at once.
As the chart above shows, a mid-day rebound pushed the S&P 500 back above its flatline, but it slipped into the close with a minor loss, with the Dow following suit. The Nasdaq showed more bullishness and eked out a small gain.
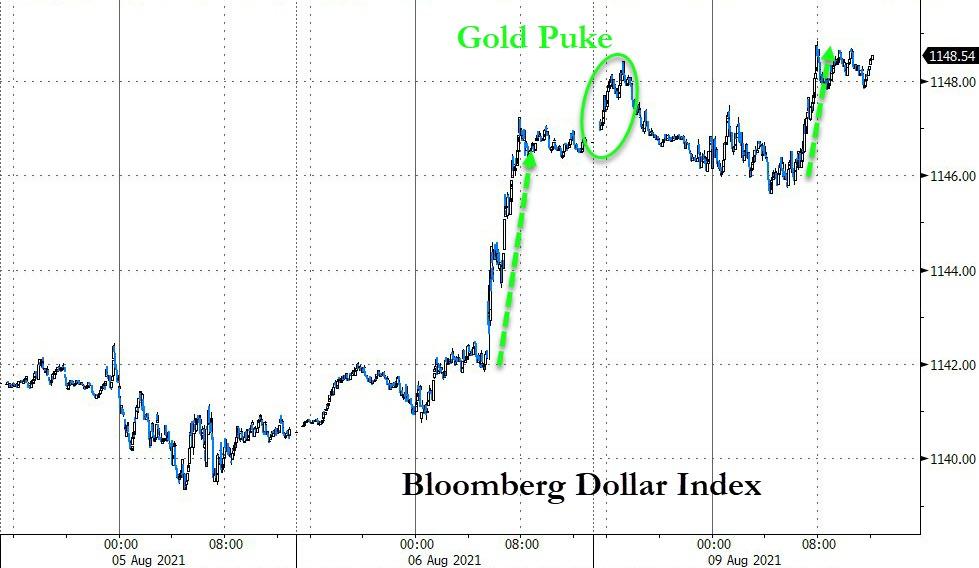
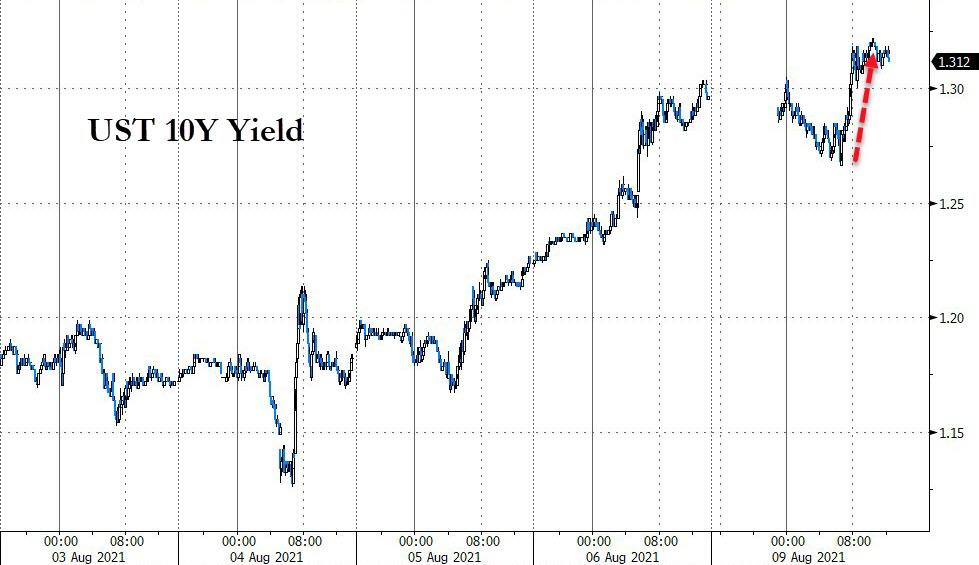
The US Dollar continued its upswing from last Friday but wavered during this session yet gained modestly in the end. Not helping gold nor stocks was the 10-year bond yield which, after an early pullback, found some momentum and reclaimed its 1.3% level.
Small Caps (VBK) slipped moderately while Value (RPV) gained a tad, as financials (XLF) were favored (+0.26%) due to rising bond yields.
Looking at the big picture, the markets went nowhere with some gainers offsetting some losers.
2. ETFs in the Spotlight
In case you missed the announcement and description of this section, you can read it here again.
It features some of the 10 broadly diversified domestic and sector ETFs from my HighVolume list as posted every Saturday. Furthermore, they are screened for the lowest MaxDD% number meaning they have been showing better resistance to temporary sell offs than all others over the past year.
The below table simply demonstrates the magnitude with which these ETFs are fluctuating above or below their respective individual trend lines (%+/-M/A). A break below, represented by a negative number, shows weakness, while a break above, represented by a positive percentage, shows strength.
For hundreds of ETF choices, be sure to reference Thursday’s StatSheet.
For this current domestic “Buy” cycle, here’s how some our candidates have fared:
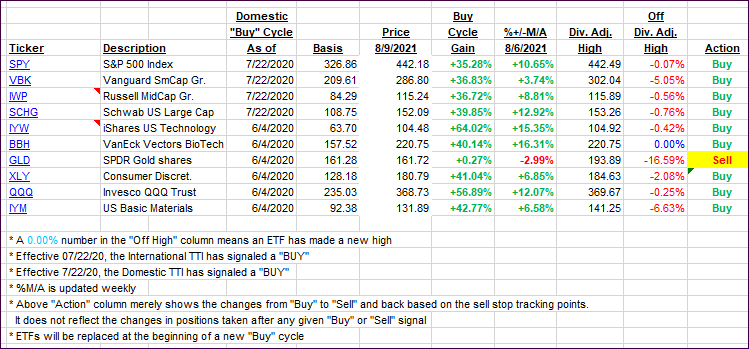
Click image to enlarge.
Again, the %+/-M/A column above shows the position of the various ETFs in relation to their respective long-term trend lines, while the trailing sell stops are being tracked in the “Off High” column. The “Action” column will signal a “Sell” once the -8% point has been taken out in the “Off High” column. For more volatile sector ETFs, the trigger point is -10%.
3. Trend Tracking Indexes (TTIs)
Our TTIs retreated as this was one trading day where not much was gained and not much was lost.
This is how we closed 08/09/2021:
Domestic TTI: +10.20% above its M/A (prior close +10.45%)—Buy signal effective 07/22/2020.
International TTI: +6.63% above its M/A (prior close +6.80%)—Buy signals effective 07/22/2020.
Disclosure: I am obliged to inform you that I, as well as my advisory clients, own some of the ETFs listed in the above table. Furthermore, they do not represent a specific investment recommendation for you, they merely show which ETFs from the universe I track are falling within the specified guidelines.
All linked charts above are courtesy of Bloomberg via ZeroHedge.
Contact Ulli