
- Moving the markets
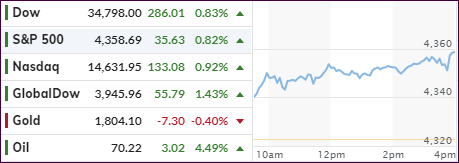
The rebound continued into its second day with Monday’s losses now having been completely recaptured by all three major indexes. Better-than-expected earnings helped power the revival with Coca-Cola and Johnsen & Johnsen stoking the bullish attitude.
The bounce-back was broad based with Small Caps (VBK) adding another +1.31%, but they were slightly outgunned by “value” (RPV), which rallied +1.62%. If the commodities index (DBC) is any indication, inflation is still alive and with us, as this index jumped +2.00% on the session.
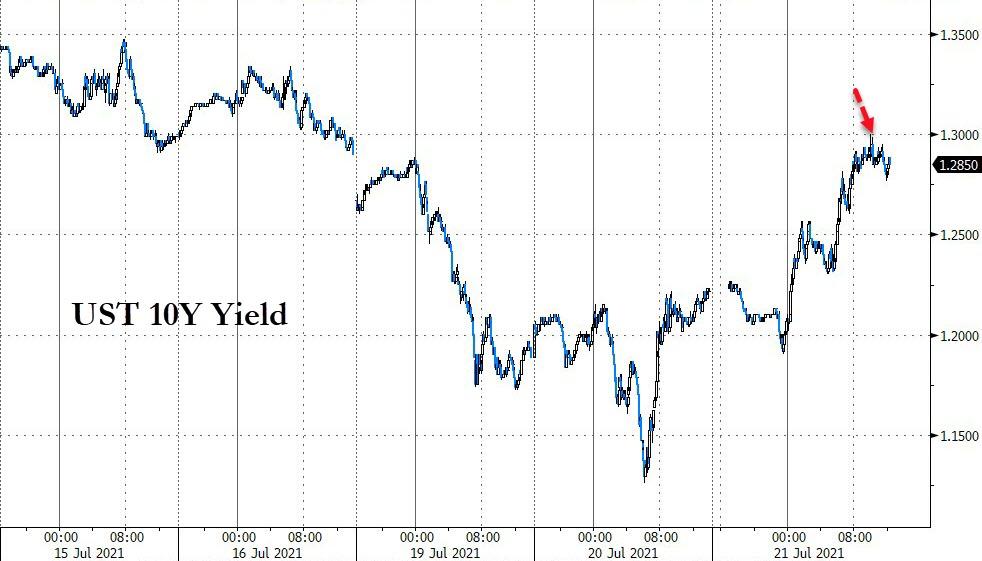
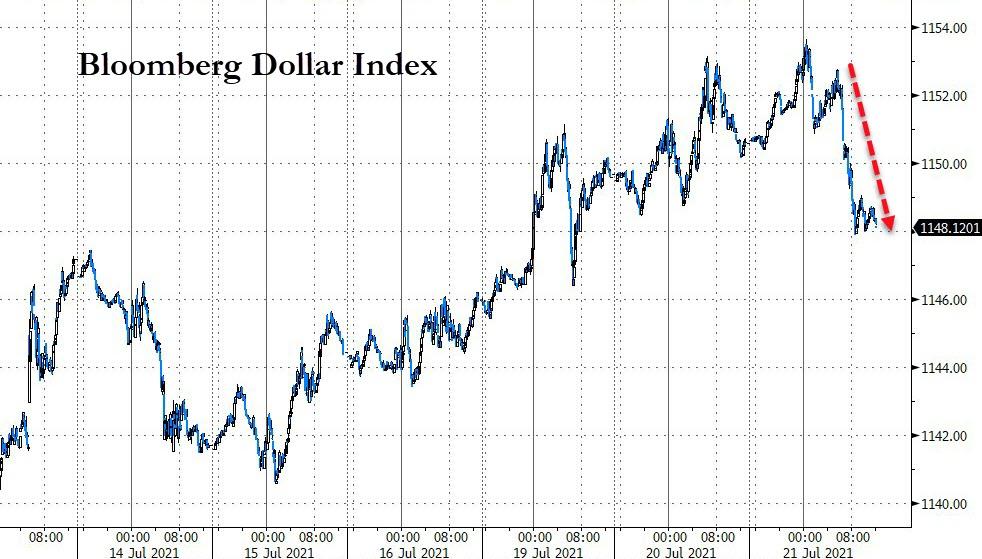
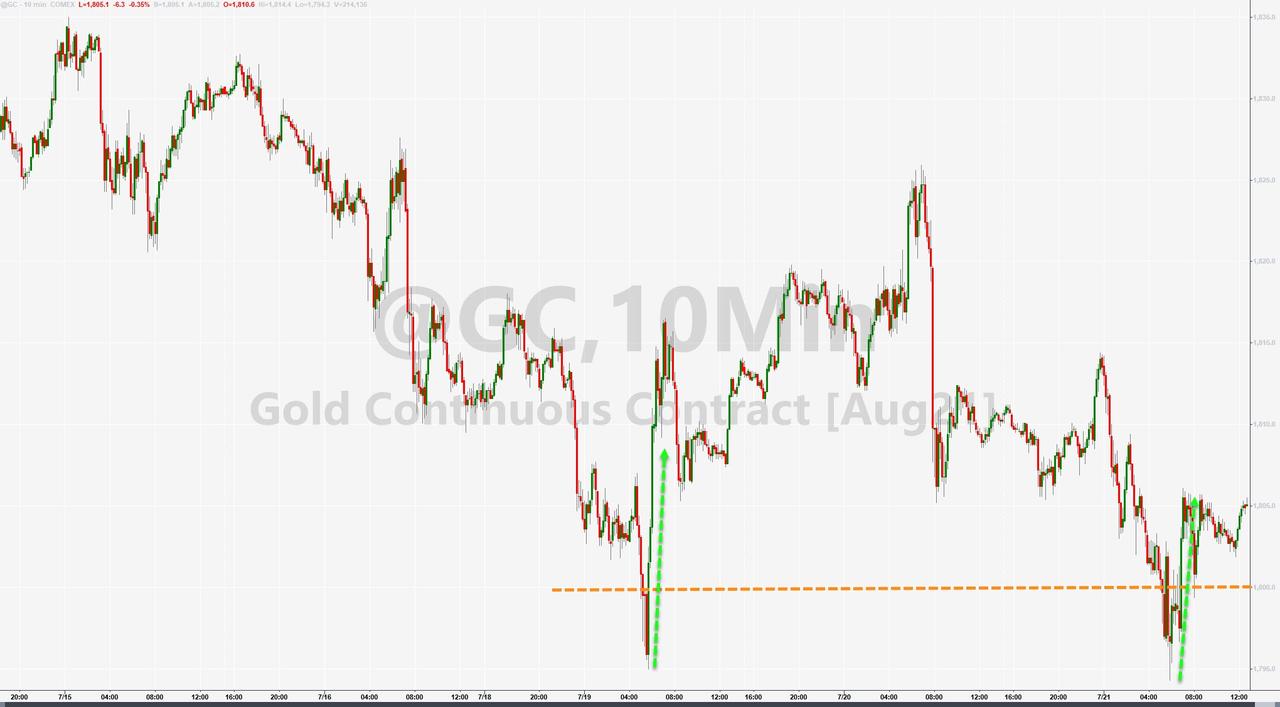
The financials (XLF) participated as well and raced ahead by +1.70% propelled by rising bond yields with the 10-year touching the 1.30% level before pulling back. The US Dollar slipped, but climbing yields were too much of a hurdle to overcome for Gold, so the precious metal gave back -0.39% and is now only barely hanging on to its $1,800 level.
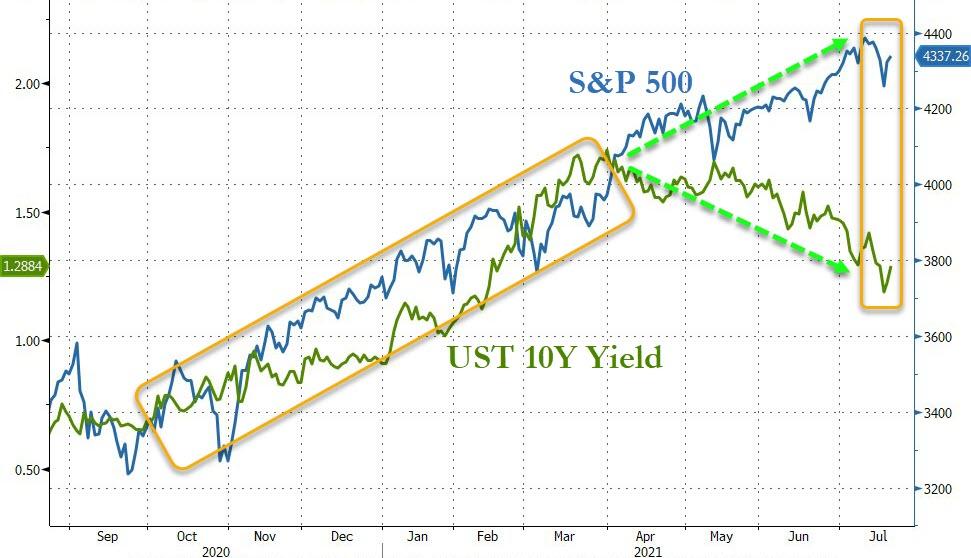
Again, the markets will have to deal with a split in direction between the S&P 500 and the 10-year bond yield, as Bloomberg shows in this chart.
Right now, it’s anyone’s guess how this relationship will normalize.
2. ETFs in the Spotlight
In case you missed the announcement and description of this section, you can read it here again.
It features some of the 10 broadly diversified domestic and sector ETFs from my HighVolume list as posted every Saturday. Furthermore, they are screened for the lowest MaxDD% number meaning they have been showing better resistance to temporary sell offs than all others over the past year.
The below table simply demonstrates the magnitude with which these ETFs are fluctuating above or below their respective individual trend lines (%+/-M/A). A break below, represented by a negative number, shows weakness, while a break above, represented by a positive percentage, shows strength.
For hundreds of ETF choices, be sure to reference Thursday’s StatSheet.
For this current domestic “Buy” cycle, here’s how some our candidates have fared:
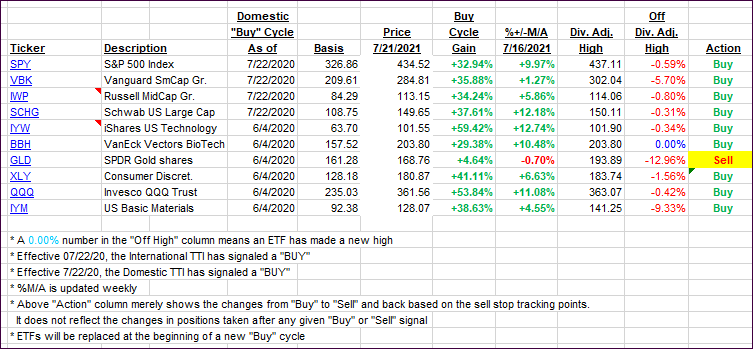
Click image to enlarge.
Again, the %+/-M/A column above shows the position of the various ETFs in relation to their respective long-term trend lines, while the trailing sell stops are being tracked in the “Off High” column. The “Action” column will signal a “Sell” once the -8% point has been taken out in the “Off High” column. For more volatile sector ETFs, the trigger point is -10%.
3. Trend Tracking Indexes (TTIs)
Our TTIs continued their recovery on the backs of the major indexes advancing.
This is how we closed 07/21/2021:
Domestic TTI: +10.75% above its M/A (prior close +9.65%)—Buy signal effective 07/22/2020.
International TTI: +6.58% above its M/A (prior close +5.15%)—Buy signals effective 07/22/2020.
Disclosure: I am obliged to inform you that I, as well as my advisory clients, own some of the ETFs listed in the above table. Furthermore, they do not represent a specific investment
recommendation for you, they merely show which ETFs from the universe I track are falling within the specified guidelines.
All linked charts above are courtesy of Bloomberg via ZeroHedge.
Contact Ulli