
- Moving the markets
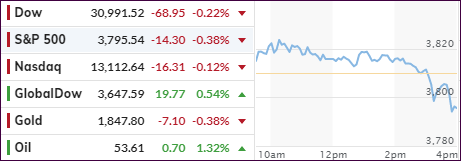
An early rally bit the dust during the last 2 trading hours with the major indexes surrendering early gains and dumping into the red. Given recent advances the drop was modest with the Dow and Nasdaq faring the best with a loss of -0.22% and -0.12% respectively.
MidCaps and GLD hung around the unchanged line, while SmallCaps bucked the weakness in the markets by powering ahead +2.08%, thereby increasing their YTD gain to around +10%.
The focus of the day was Biden’s upcoming stimulus plan, which had traders on edge all session, and even the pre-programmed computer algos were not able to maintain bullish momentum into the close.
Added CNBC:
President-elect Joe Biden is expected on Thursday evening to unveil a stimulus plan that will include a boost to the recent $600 direct payments, an extension of increased unemployment insurance and support for state and local governments. The stimulus could be as big as $2 trillion.
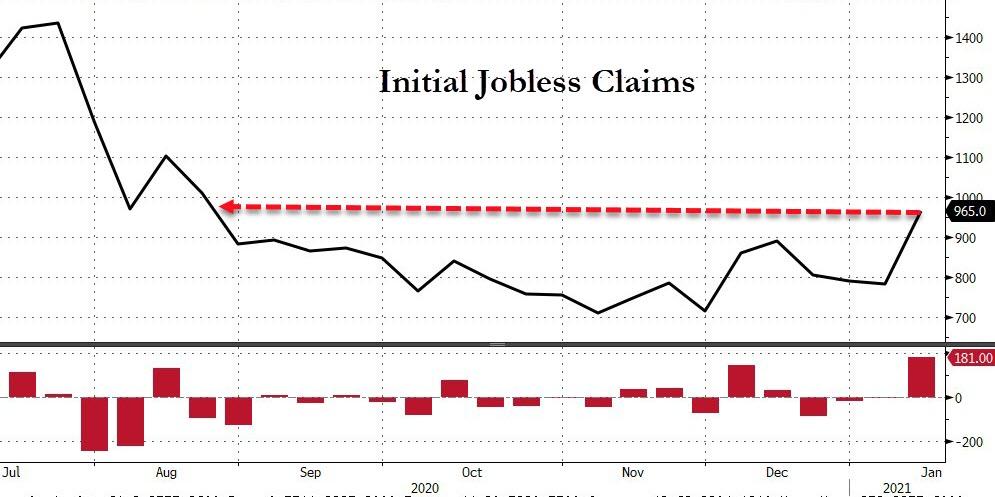
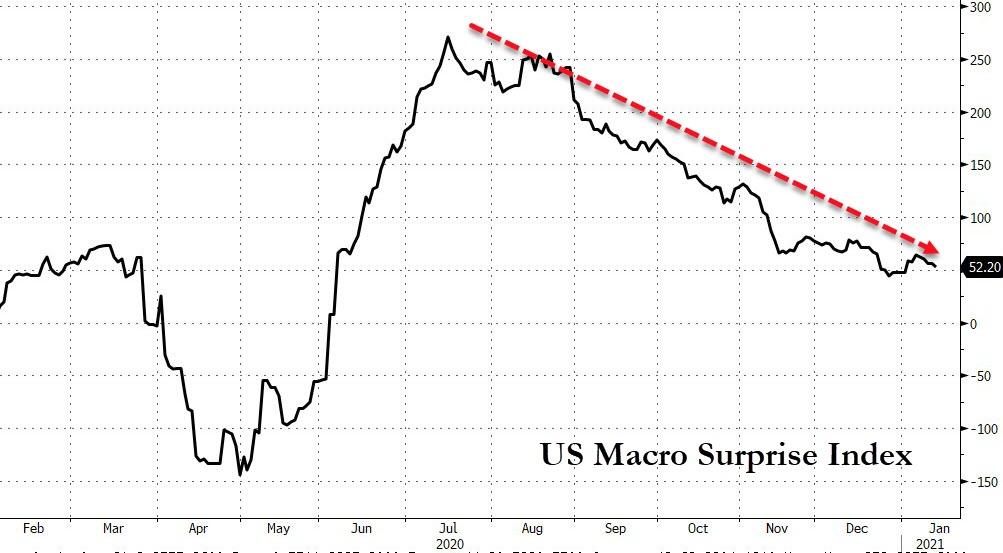
On the economic front, traders had to digest worse than expected Initial Jobless Claims Data, which rocketed to their highest since August. A stunning 965k Americans filed for the first time, which was a massive increase over last week’s 784k and way above expectations of 789k. This again confirms the disappointing trend in economic data.
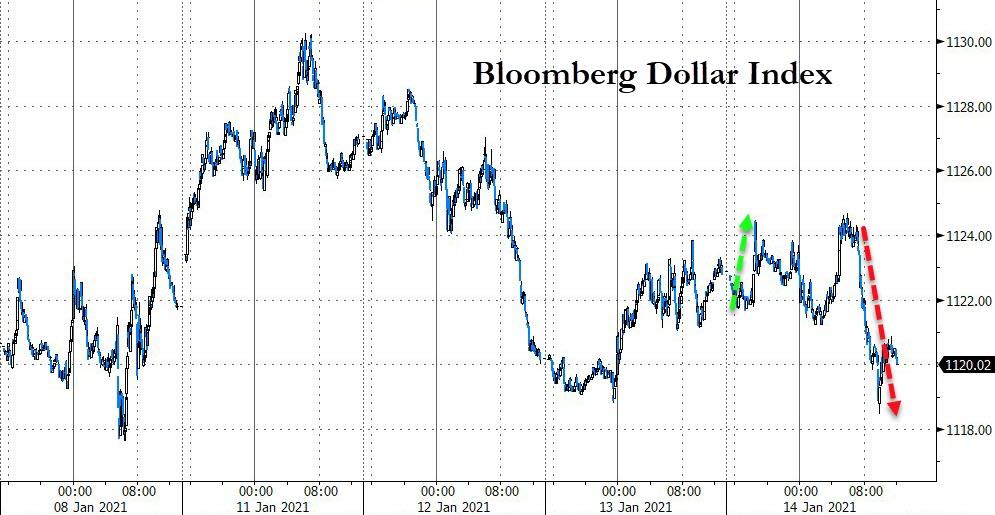
The US Dollar initially rallied but then hit a glass ceiling, bounced off and headed sharply south. Gold’s overnight’s spike lower reversed, but in the end, the precious metal drifted south and was not able to hang on to its gains.
Bond yields spiked again with the 10-year now at 1.13% after having dropped below 1.9% intra-day. Much of tomorrow’s market direction will come from the interpretation of Biden’s fiscal bonanza speech tonight. Anything less than expected will likely give the bears some support, though possibly only for the short-term.
2. ETFs in the Spotlight
In case you missed the announcement and description of this section, you can read it here again.
It features some of the 10 broadly diversified domestic and sector ETFs from my HighVolume list as posted every Saturday. Furthermore, they are screened for the lowest MaxDD% number meaning they have been showing better resistance to temporary sell offs than all others over the past year.
The below table simply demonstrates the magnitude with which these ETFs are fluctuating above or below their respective individual trend lines (%+/-M/A). A break below, represented by a negative number, shows weakness, while a break above, represented by a positive percentage, shows strength.
For hundreds of ETF choices, be sure to reference Thursday’s StatSheet.
For this current domestic “Buy” cycle, here’s how some our candidates have fared:
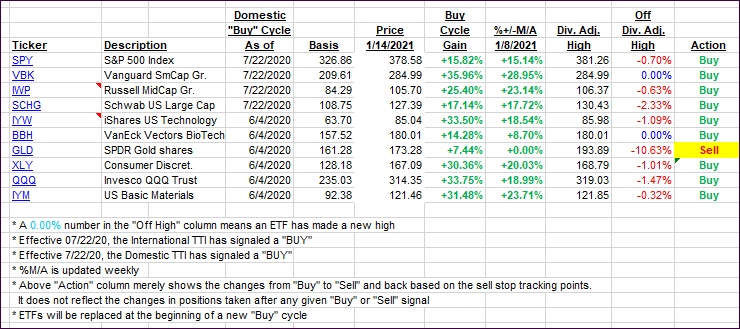
Click image to enlarge.
Again, the %+/-M/A column above shows the position of the various ETFs in relation to their respective long-term trend lines, while the trailing sell stops are being tracked in the “Off High” column. The “Action” column will signal a “Sell” once the -8% point has been taken out in the “Off High” column. For more volatile sector ETFs, the trigger point is -10%.
3. Trend Tracking Indexes (TTIs)
Our TTIs bounced higher despite the late-day sell off.
This is how we closed 1/14/2021:
Domestic TTI: +21.32% above its M/A (prior close +20.91%)—Buy signal effective 07/22/2020.
International TTI: +20.99% above its M/A (prior close +20.32%)—Buy signal effective 07/22/2020.
Disclosure: I am obliged to inform you that I, as well as my advisory clients, own some of the ETFs listed in the above table. Furthermore, they do not represent a specific investment recommendation for you, they merely show which ETFs from the universe I track are falling within the specified guidelines.
Contact Ulli