
- Moving the markets
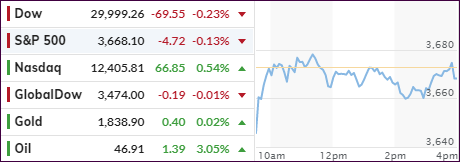
The rebounding efforts after yesterday’s slump already failed in the futures market, and this uncertainty carried over into the regular session with the Dow and S&P slipping, while the Nasdaq shook off weakness and closed in the green by +0.54%.
Some market sectors saw solid increases, such as SmallCaps (IWO) and MidCaps (IWP), which gained +1.5% and +1.08% respectively, both of which own in my advisory practice.
The lack of a driver to ramp the markets higher was apparent as lawmakers continued with stimulus struggles with doubt spreading that an agreement might not be reached before the end of this year.
But the band aid approach was used to at least keep the government operating for another few days, as CNBC reported:
The House of Representatives passed a government funding extension Wednesday that would keep the federal government running through Dec. 18 and buy time for further negotiations for a bigger relief bill.
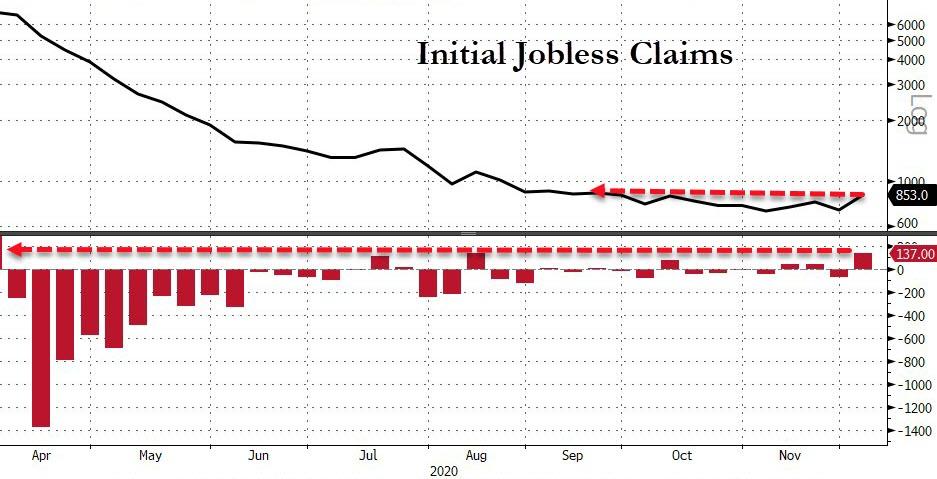
On the economic front, talk of a V-shape recovery has pretty much disappeared with the latest Initial Jobless Claims jumping the most since March. Commented ZH:
Initial claims printed 853k (vs 725k exp), a 137k jump from last week and the biggest weekly increase in new claims since March…
This is the highest number of new benefits seekers in three months.
Continuing Claims also rose on the week, from 5.527mm to 5.757mm – the first increase since August and biggest increase since May…
But the total number of unemployment claimants has dropped below 20 million…
In the end, traders saw no reason to jump in the markets, and even the ever-present computer algos seemed to lack motivation to commit.
2. ETFs in the Spotlight
In case you missed the announcement and description of this section, you can again.
It features some of the 10 broadly diversified domestic and sector ETFs from my HighVolume list as posted every Saturday. Furthermore, they are screened for the lowest MaxDD% number meaning they have been showing better resistance to temporary sell offs than all others over the past year.
The below table simply demonstrates the magnitude with which these ETFs are fluctuating above or below their respective individual trend lines (%+/-M/A). A break below, represented by a negative number, shows weakness, while a break above, represented by a positive percentage, shows strength.
For hundreds of ETF choices, be sure to reference Thursday’s StatSheet.
For this current domestic “Buy” cycle, here’s how some our candidates have fared:
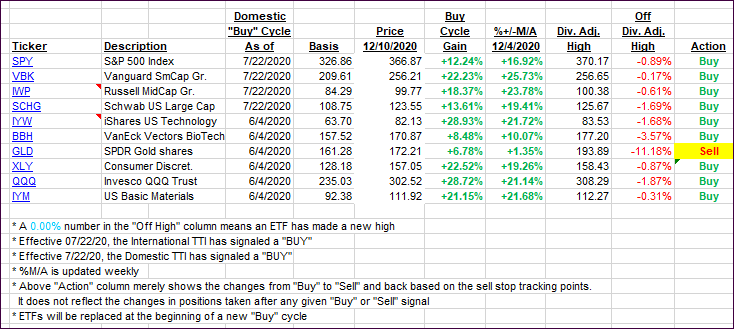
Click image to enlarge
Again, the %+/-M/A column above shows the position of the various ETFs in relation to their respective long-term trend lines, while the trailing sell stops are being tracked in the “Off High” column. The “Action” column will signal a “Sell” once the -8% point has been taken out in the “Off High” column. For more volatile sector ETFs, the trigger point is -10%.
3. Trend Tracking Indexes (TTIs)
Our TTIs changed only irrelevantly.
This is how we closed 12/10/2020:
Domestic TTI: +22.07% above its M/A (prior close +21.96%)—Buy signal effective 07/22/2020
International TTI: +20.80% above its M/A (prior close +20.79%)—Buy signal effective 07/22/2020
Disclosure: I am obliged to inform you that I, as well as my advisory clients, own some of the ETFs listed in the above table. Furthermore, they do not represent a specific investment recommendation for you, they merely show which ETFs from the universe I track are falling within the specified guidelines.
Contact Ulli