
- Moving the markets
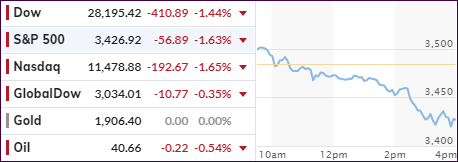
An early 100-point bounce in the Dow turned into a late trounce again with the major indexes accelerating to the downside late in the session. With only 1 day left until a key deadline for an aid package set by Pelosi becomes effective, traders took the lack progress as a bad omen and selling sped up.
Added CNBC:
Tom Block, Washington policy strategist at Fundstrat Global Advisors, thinks it is possible that a deal between the Trump administration and Pelosi can be reached.
“Both sides seem to have an incentive to get a deal done,” Block said in a note to clients. He also added that “the dynamics of the lame duck could be poisonous if Trump loses, or Republicans lose control of the Senate. The safer course of action seems to be to pass a bill now, and if there is a blue wave more stimulus early in 2021.”
While the Dow and the S&P 500 had their worst day since September 23rd, the Nasdaq logged its first 5-day losing streak since August.
Even though Pelosi and Mnushin were scheduled to talk later today, any potential deal was “not sounding imminent,” according to the Washington Post. However, should the warring parties suddenly come to an agreement, a relief rally would be a foregone conclusion; however, the duration of such would be questionable.
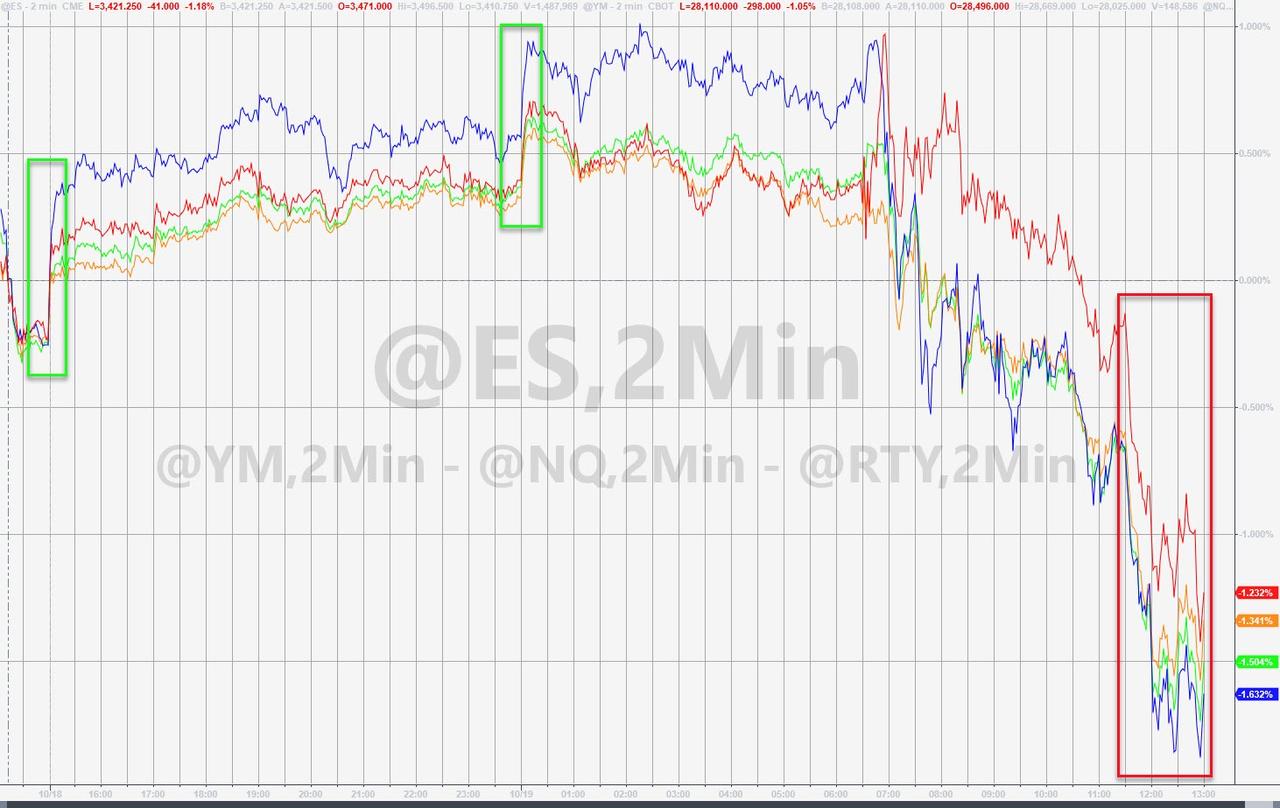
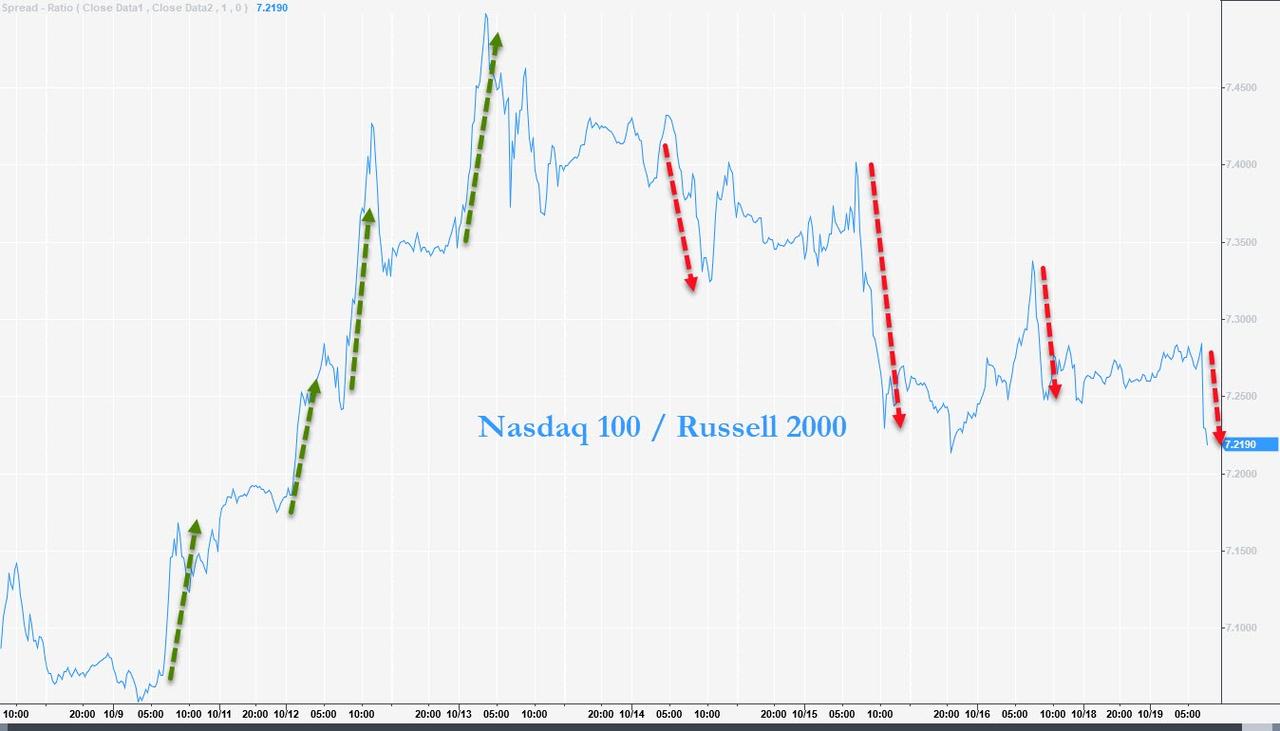
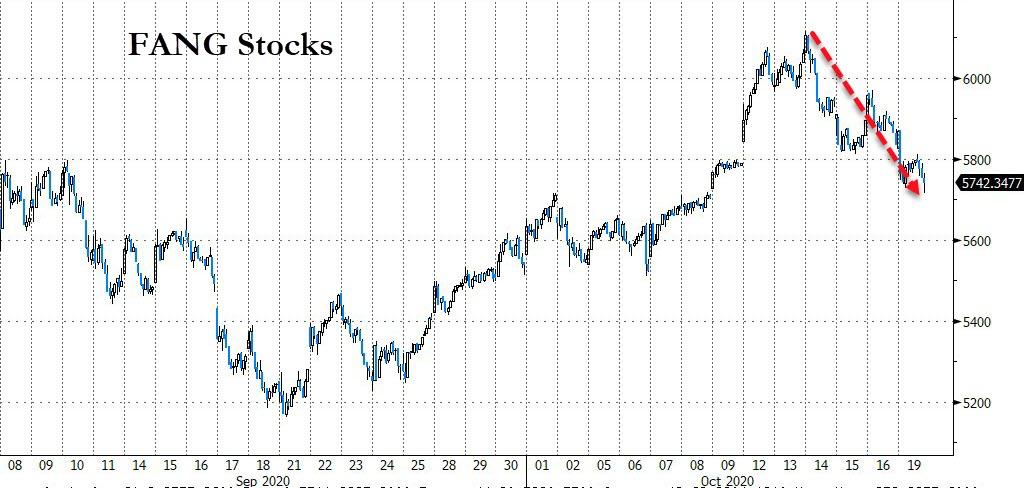
That also brings up the question, as to whether the big tech unwind, charted here by ZH, can be reversed, or not. How about the sliding FANG stocks? Or the skidding banking sector?
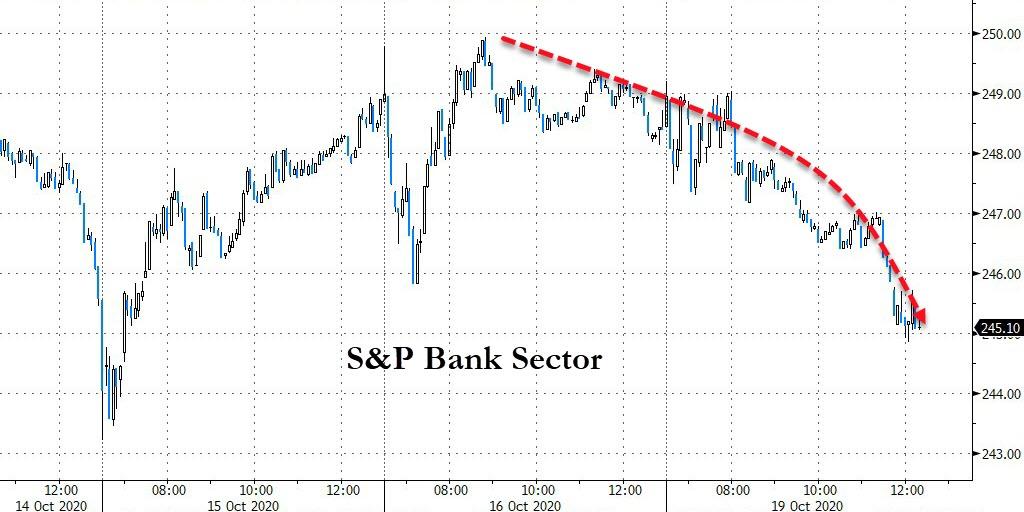
More questions than answers…
2. ETFs in the Spotlight
In case you missed the announcement and description of this section, you can read it here again.
It features some of the 10 broadly diversified domestic and sector ETFs from my HighVolume list as posted every Saturday. Furthermore, they are screened for the lowest MaxDD% number meaning they have been showing better resistance to temporary sell offs than all others over the past year.
The below table simply demonstrates the magnitude with which these ETFs are fluctuating above or below their respective individual trend lines (%+/-M/A). A break below, represented by a negative number, shows weakness, while a break above, represented by a positive percentage, shows strength.
For hundreds of ETF choices, be sure to reference Thursday’s StatSheet.
For this current domestic “Buy” cycle, here’s how some our candidates have fared:
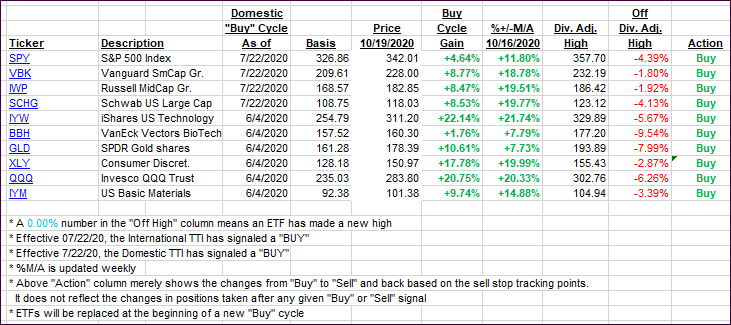
Click image to enlarge
Again, the %+/-M/A column above shows the position of the various ETFs in relation to their respective long-term trend lines, while the trailing sell stops are being tracked in the “Off High” column. The “Action” column will signal a “Sell” once the -8% point has been taken out in the “Off High” column. For more volatile sector ETFs, the trigger point is -10%.
3. Trend Tracking Indexes (TTIs)
Our TTIs dropped as the major indexes were controlled by bearish sentiment.
This is how we closed 10/19/2020:
Domestic TTI: +9.40% above its M/A (prior close +10.88%)—Buy signal effective 07/22/2020
International TTI: +5.98% above its M/A (prior close +5.49%)—Buy signal effective 07/22/2020
Disclosure: I am obliged to inform you that I, as well as my advisory clients, own some of the ETFs listed in the above table. Furthermore, they do not represent a specific investment recommendation for you, they merely show which ETFs from the universe I track are falling within the specified guidelines.
Contact Ulli