
ETF Tracker StatSheet
You can view the latest version here.
AIMLESS MEANDERING
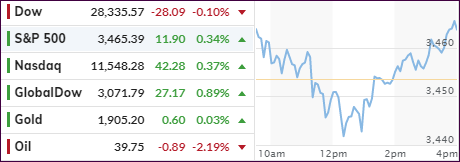
- Moving the markets
While the chart above shows a nice rebound for the S&P 500 off its mid-day lows, keep in mind that today’s activity happened within a very narrow trading range of less than 1%.
Traders were not willing to commit one way or the other and neither did the computer algos. This theme of going nowhere fast was present throughout the week with the end effect being a minor loss of some -0.5% for the index.
Of course, this lack of action was the result of the fallout from the no stimulus deal, despite both parties trying to keep the dream alive with entertaining quotes like “work hard,” “bill can be passed,” “back and forth” and “not budging one inch.”
“I think everyone is in wait-and-see mode,” said Mike Katz, partner at Seven Points Capital. “There’s a lot of back and forth on stimulus and every headline makes the market move a little bit, but there’s no follow-through because we don’t have a clear picture on that front.”
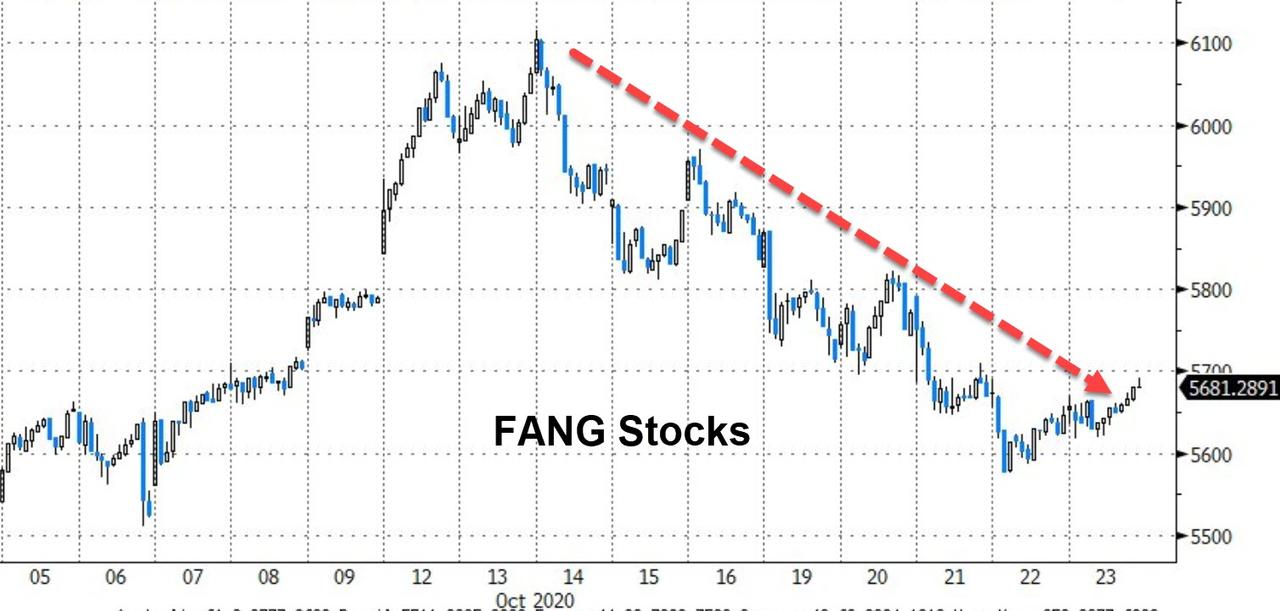
On the earnings side, Intel got hammered with its share price losing over 10% on mixed quarterly numbers. Overall, the tech sector fell over 2% on concerns that a Democratic sweep could lead to higher taxes and tougher regulations.
ZH summed up the week like this:
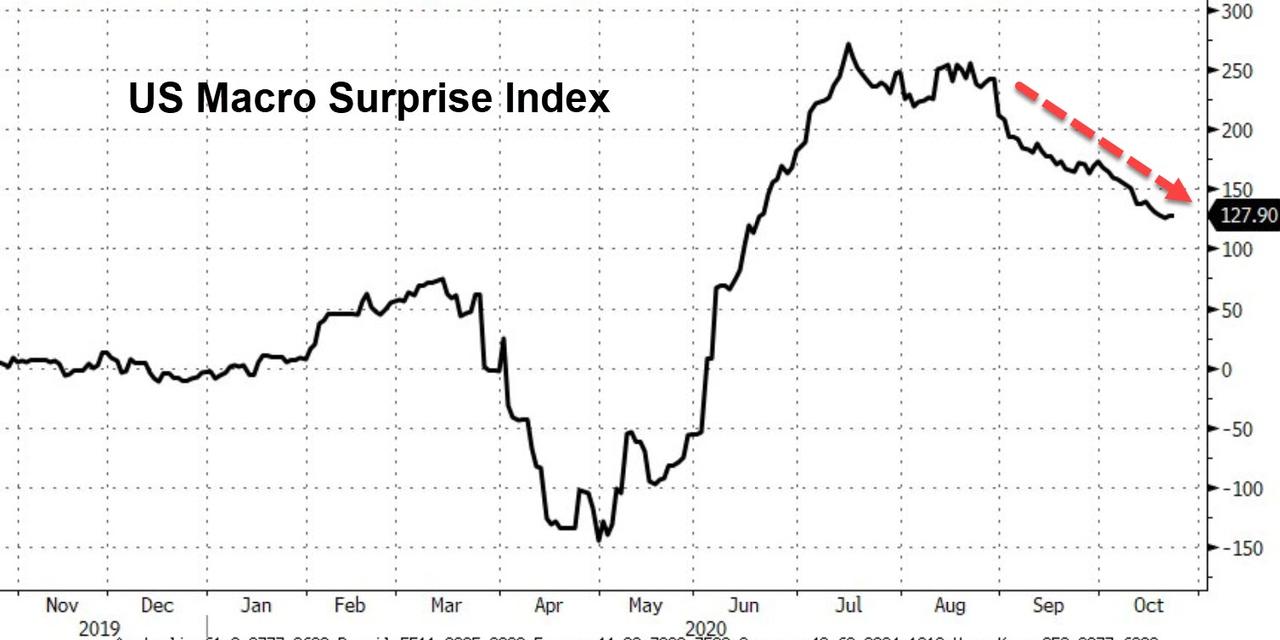
Stocks were down, bond (prices) were down, oil was down, the dollar was down, and economic data was down…
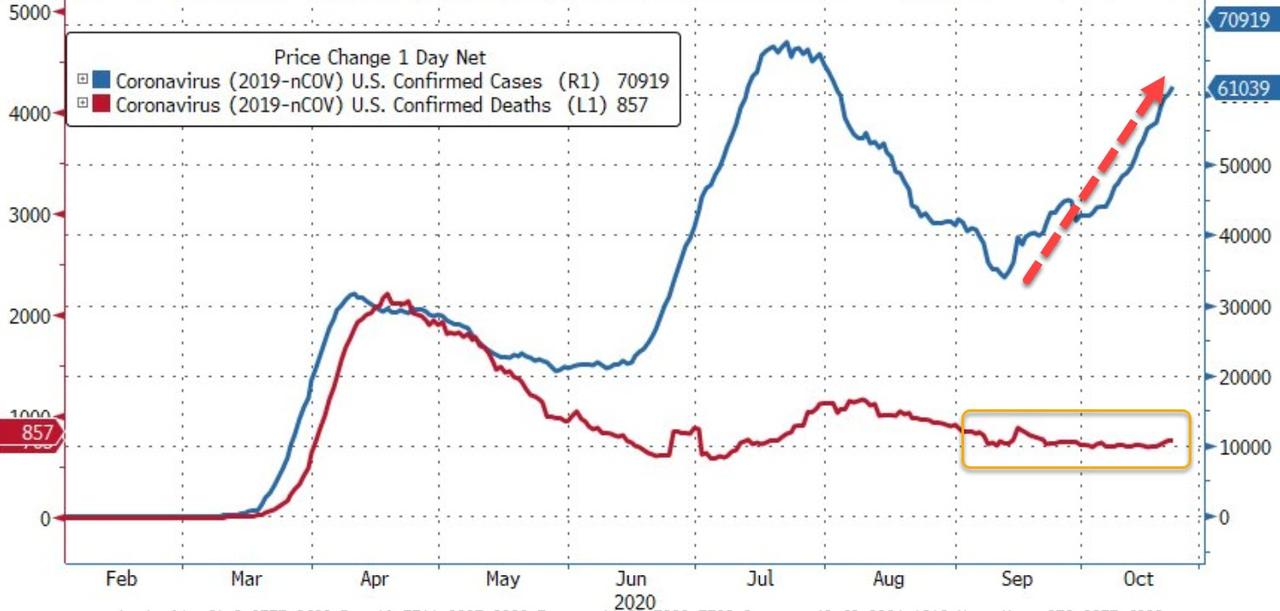
While the following is outside of my area of expertise, namely the Covid-19 pandemic, take a look at this chart and ask yourself “is the current panic really justified?”
2. ETFs in the Spotlight
In case you missed the announcement and description of this section, you can read it here again.
It features some of the 10 broadly diversified domestic and sector ETFs from my HighVolume list as posted every Saturday. Furthermore, they are screened for the lowest MaxDD% number meaning they have been showing better resistance to temporary sell offs than all others over the past year.
The below table simply demonstrates the magnitude with which these ETFs are fluctuating above or below their respective individual trend lines (%+/-M/A). A break below, represented by a negative number, shows weakness, while a break above, represented by a positive percentage, shows strength.
For hundreds of ETF choices, be sure to reference Thursday’s StatSheet.
For this current domestic “Buy” cycle, here’s how some our candidates have fared:
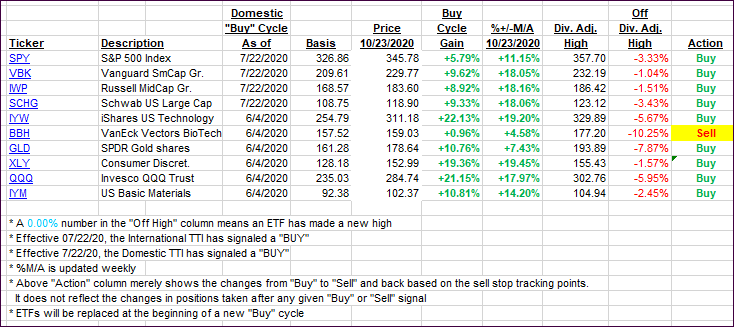
Click image to enlarge
Again, the %+/-M/A column above shows the position of the various ETFs in relation to their respective long-term trend lines, while the trailing sell stops are being tracked in the “Off High” column. The “Action” column will signal a “Sell” once the -8% point has been taken out in the “Off High” column. For more volatile sector ETFs, the trigger point is -10%.
3. Trend Tracking Indexes (TTIs)
Our TTIs headed higher, as we saw again broad based participation in this relatively small move.
This is how we closed 10/23/2020:
Domestic TTI: +11.62% above its M/A (prior close +11.02%)—Buy signal effective 07/22/2020
International TTI: +7.47% above its M/A (prior close +6.60%)—Buy signal effective 07/22/2020
Disclosure: I am obliged to inform you that I, as well as my advisory clients, own some of the ETFs listed in the above table. Furthermore, they do not represent a specific investment recommendation for you, they merely show which ETFs from the universe I track are falling within the specified guidelines.
———————————————————-
WOULD YOU LIKE TO HAVE YOUR INVESTMENTS PROFESSIONALLY MANAGED?
Do you have the time to follow our investment plans yourself? If you are a busy professional who would like to have his portfolio managed using our methodology, please contact me directly or get more details here.
———————————————————
Back issues of the ETF Tracker are available on the web.
Contact Ulli