- Moving the markets
Yesterday, I pointed towards more choppiness in the markets and, as if on command, we witnessed a wild roller coaster ride today. It started with a huge dump, followed by a pump to the unchanged line, which was followed by another dump and a failed last-ditch effort to get to green.
The futures market caused some of that havoc with tech stumbling after Powell’s message that “more fiscal support is likely to be needed,” which caused concerns that the Fed’s monetary toolbox may be running empty. That thought spooked equities, and the sour mood prevailed throughout the session. As a result, traders dumped stocks, bonds, dollars and gold.
Not helping matters was the impact of inconsistent messages about the coronavirus vaccine battles and the continued battles about further stimulus.
On the economic front, we learned that another 860k Americans filed for first time jobless benefits last week, which is still more than four times the pre-Covid ‘normal’ and well above any peak week during the great financial crisis collapse, as ZH reported. And this is 7 months after the lockdowns began!
Tomorrow, traders will have to deal with quadruple witching hour, which most likely will add a load of volatility.
To add insult to injury, the analog to 1930 appears to be more than coincidental when looking at the big picture.
2. ETFs in the Spotlight
In case you missed the announcement and description of this section, you can read it here again.
It features some of the 10 broadly diversified domestic and sector ETFs from my HighVolume list as posted every Saturday. Furthermore, they are screened for the lowest MaxDD% number meaning they have been showing better resistance to temporary sell offs than all others over the past year.
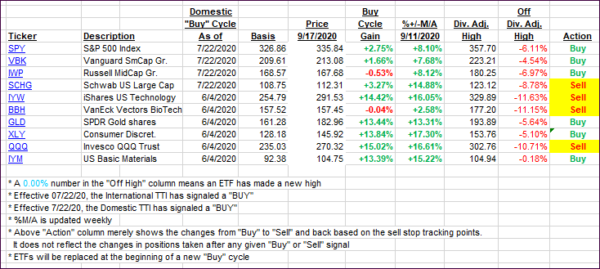
The below table simply demonstrates the magnitude with which these ETFs are fluctuating above or below their respective individual trend lines (%+/-M/A). A break below, represented by a negative number, shows weakness, while a break above, represented by a positive percentage, shows strength.
For hundreds of ETF choices, be sure to reference Thursday’s StatSheet.
For this current domestic “Buy” cycle, here’s how some our candidates have fared:

Click image to enlarge
Again, the %+/-M/A column above shows the position of the various ETFs in relation to their respective long-term trend lines, while the trailing sell stops are being tracked in the “Off High” column. The “Action” column will signal a “Sell” once the -8% point has been taken out in the “Off High” column. For more volatile sector ETFs, the trigger point is -10%.
3. Trend Tracking Indexes (TTIs)
Our TTIs retreated with the markets.
This is how we closed 09/17/2020:
Domestic TTI: +7.67% above its M/A (prior close +8.14%)—Buy signal effective 07/22/2020
International TTI: +5.84% above its M/A (prior close +6.38%)—Buy signal effective 07/22/2020
Disclosure: I am obliged to inform you that I, as well as my advisory clients, own some of the ETFs listed in the above table. Furthermore, they do not represent a specific investment recommendation for you, they merely show which ETFs from the universe I track are falling within the specified guidelines.
Contact Ulli