
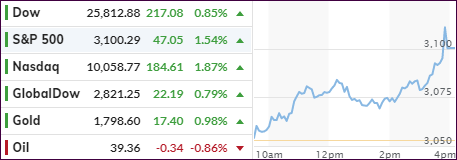
- Moving the markets
On the last day of the quarter, bullish sentiment shifted into overdrive following the widely held theme of the past 90 days, that a V-shape recovery is in the cards.
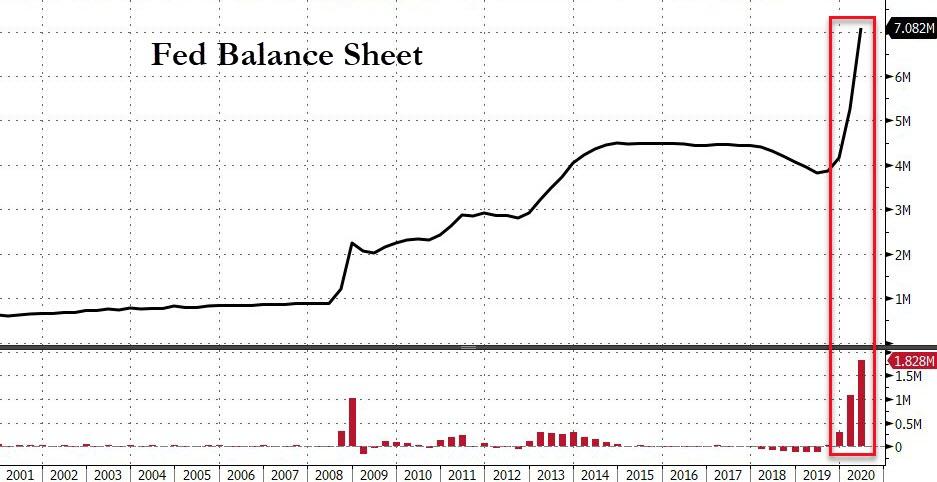
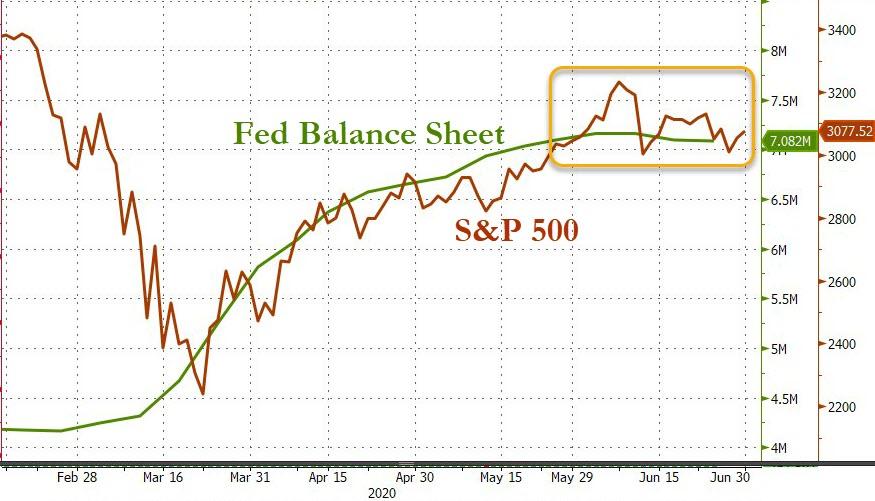
Of course, this rebound off the March lows has nothing to do with economic progress but everything with the Fed’s reckless money printing efforts with some $3 trillion finding its way into the markets, which rode the liquidity train with utter abandon.
However, this latest 2-day levitation managed to not only wipe out last Friday’s losses but also threw another big assist to those Buy-and-holders, who toughed it out by being fully invested during the last quarter.
The headline propaganda of this having been the best quarter in about 20 years reminds me of the gambler, who only talks about his gains and never his losses.
Here’s the S&P 500 chart showing clearly that this quarter only served to make up losses and not create any gains when looking at the year 2020:
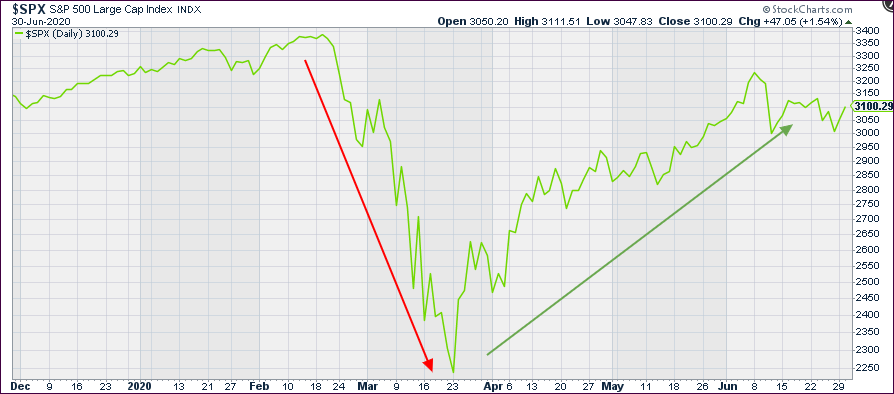
As you can see, the rebound was truly impressive, thanks to the Fed’s balance sheet explosion, but it merely bailed out those that were stuck holding on to their portfolios. For sure, there were some gutsy speculators, who had the nerve to try to catch this falling knife along the crash, so, congrats to them. They got lucky this time.
Most of today’s attention went to joint testimony from Mnuchin and Powell, which MarketWatch summarized like this:
Mnuchin said the Treasury and Fed were looking at extending the Fed’s established 11 emergency lending facilities, but also reiterated that additional types of COVID-19 aid likely will need to be addressed by Congress under the next phase of stimulus.
The Fed’s Powell stressed that the ‘overriding goal’ of the central bank’s facilities is to help get the roughly 25 million workers who lost jobs during the pandemic back to work, while also warning that the worst part of a second wave of COVID-19 infections would be if it undermines consumer confidence.
Of course, giving a huge assist to the bulls in Q2, was the biggest short squeeze ever, as ZeroHedge pointed to in this chart:
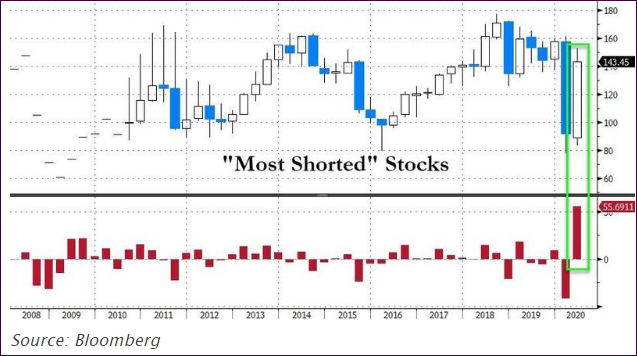
The question is will this continue or not? For sure, our Trend Tracking Indexes (TTIs) made up some lost ground from last week, but it will take another push to generate a new “Buy.”
Usually, after the quarter-ending window dressing is over, we may see a pullback, the severity of which will depend on the latest Covid-19 news followed by earnings announcements within the next two weeks.
I enjoy looking at historical chart overlays depicting potentially opposite outcomes. ZH presented it like this:
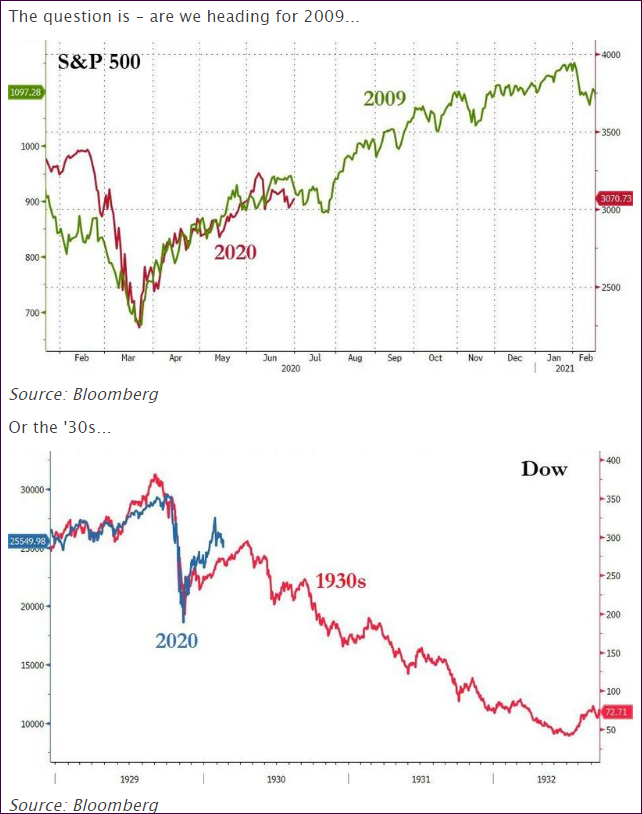
It’s anybody’s guess how this will turn out.
2. ETFs in the Spotlight
In case you missed the announcement and description of this section, you can read it here again.
It features some of the 10 broadly diversified domestic and sector ETFs from my HighVolume list as posted every Saturday. Furthermore, they are screened for the lowest MaxDD% number meaning they have been showing better resistance to temporary sell offs than all others over the past year.
The below table simply demonstrates the magnitude with which these ETFs are fluctuating above or below their respective individual trend lines (%+/-M/A). A break below, represented by a negative number, shows weakness, while a break above, represented by a positive percentage, shows strength.
For hundreds of ETF choices, be sure to reference Thursday’s StatSheet.
For this new domestic “Buy” cycle, which ended effective 6/25/2020, here’s how some our candidates have fared:
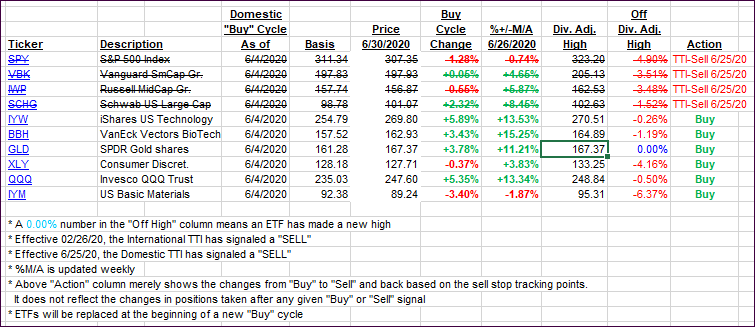
Click image to enlarge
Again, the %+/-M/A column above shows the position of the various ETFs in relation to their respective long-term trend lines, while the trailing sell stops are being tracked in the “Off High” column. The “Action” column will signal a “Sell” once the -8% point has been taken out in the “Off High” column. For more volatile sector ETFs, the trigger point is -10%.
3. Trend Tracking Indexes (TTIs)
Our TTIs again improved and, with especially the Domestic one pushing harder towards another trend line crossing.
This is how we closed 06/30/2020:
Domestic TTI: -1.70% below its M/A (prior close -3.01%)—Sell signal effective 06/25/2020
International TTI: -3.73% below its M/A (prior close -4.46%)—Sell signal effective 02/26/2020
Disclosure: I am obliged to inform you that I, as well as my advisory clients, own some of the ETFs listed in the above table. Furthermore, they do not represent a specific investment recommendation for you, they merely show which ETFs from the universe I track are falling within the specified guidelines.
Contact Ulli