
- Moving the markets
Here’s an analysis of the market idiocy we saw over the past couple of trading days. A tip of the hat goes to ZeroHedge for this explanation:
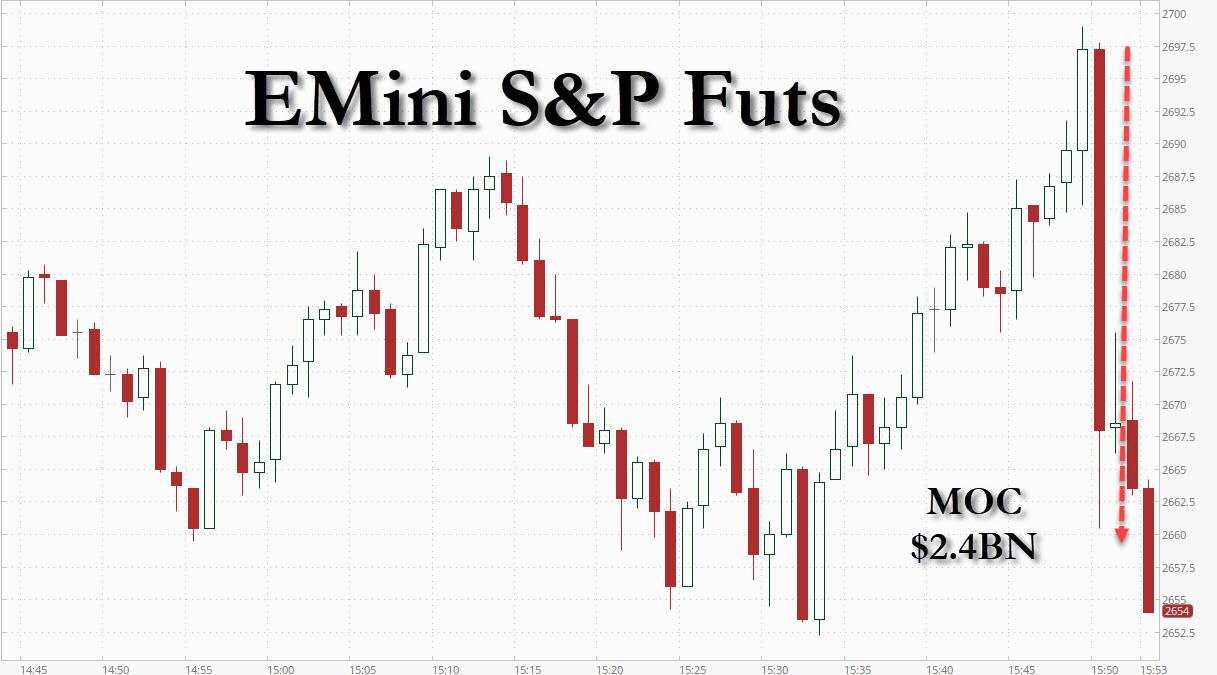
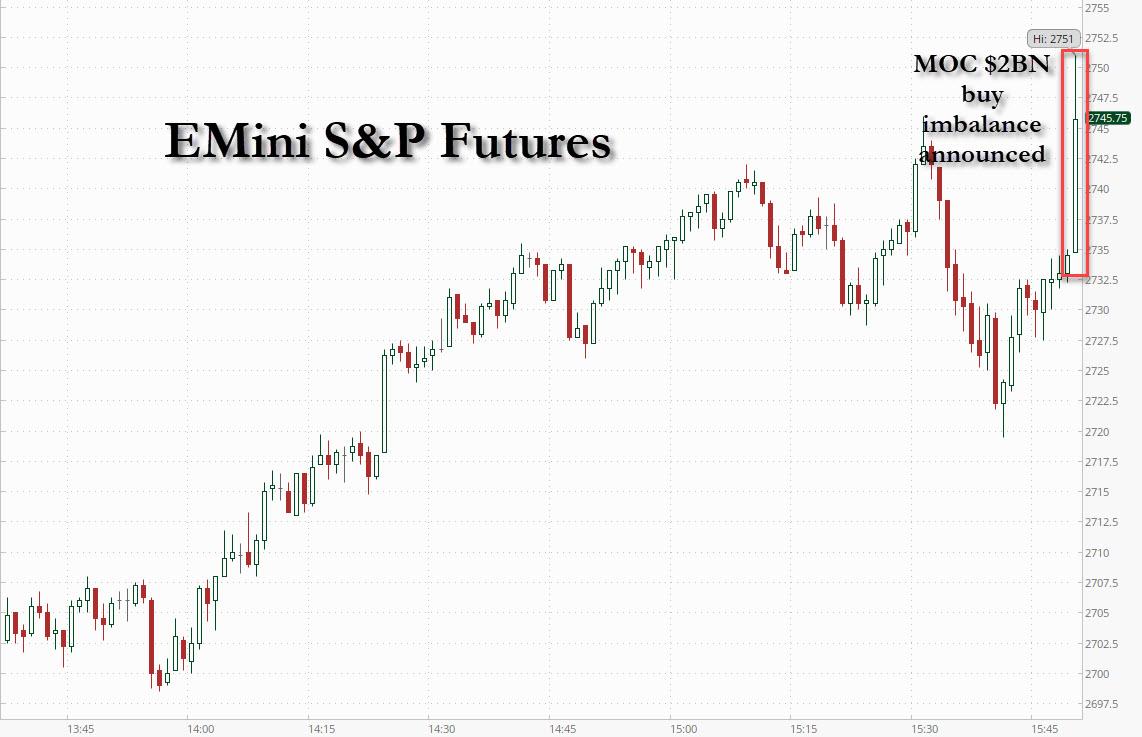
In a mirror image of yesterday’s last 10 minutes action, when the S&P dumped by 40 points in seconds, when a $2.4BN “market on close” (MOC) sale imbalance was announced at 3:50 pm ET…moments ago, at exactly 3:50 pm again when the market on close imbalance was unveiled, and revealed that there was $2 billion left to buy, the Emini future (i.e., the S&P 500) spiked higher by 20 points, from 2,732 to 2,752, which was also the session high as algos scrambled to front run the residual buy orders in the last minutes of trading.
And then the conclusion:
As a reminder, this is at least the 4th time in the past two weeks – it started on March 26 – that the MOC imbalance announcement has led to a stunning move in the market, a striking phenomenon which is attributable to one simple thing: there is absolutely no liquidity in the market, and as a result the headline MOC announcement is sufficient to send the entire market surging or tumbling…
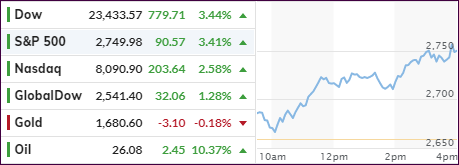
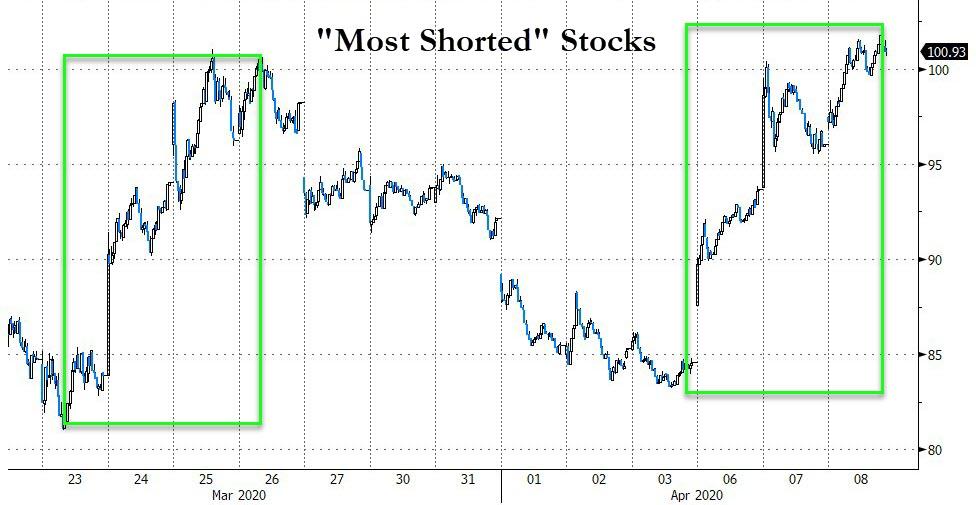
Despite yesterday having been the deadliest virus day in the world, optimistic comments by Dr. Fauci about a turning point with lower total deaths than expected, was enough to shift the headline scanning computer algos into overdrive. The day was saved with the Dow adding almost 800 points with the usual assist of another epic short-squeeze for the third day in a row.
Again, the rally of the past two days occurred despite neither economic nor earnings data having divulged the viciousness of the economic crisis that not only the U.S. but also the world has plunged into.
Analyst Bill Blain offered these succinct and true words:
“The greatest idiot is a man who thinks strong stock markets are an indication of economic health.”
As I mentioned before, this kind of volatility is typical in bear markets, and we may see more of that tomorrow, when the jobless claims numbers are sure to extract their pound of flesh from the markets.
2. ETFs in the Spotlight
In case you missed the announcement and description of this section, you can read it here again.
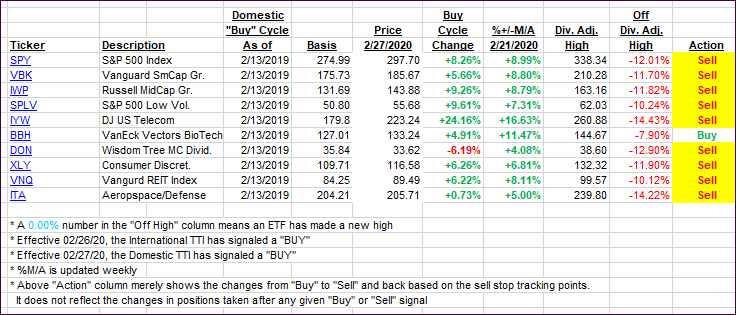
It features some of the 10 broadly diversified domestic and sector ETFs from my HighVolume list as posted every Saturday. Furthermore, they are screened for the lowest MaxDD% number meaning they have been showing better resistance to temporary sell offs than all others over the past year.
The below table simply demonstrates the magnitude with which these ETFs are fluctuating above or below their respective individual trend lines (%+/-M/A). A break below, represented by a negative number, shows weakness, while a break above, represented by a positive percentage, shows strength.
For hundreds of ETF choices, be sure to reference Thursday’s StatSheet.
For this past domestic “Buy” cycle, which ended on 2/27/2020, here’s how some our candidates have fared:
Click image to enlarge
Again, the %+/-M/A column above shows the position of the various ETFs in relation to their respective long-term trend lines, while the trailing sell stops are being tracked in the “Off High” column. The “Action” column will signal a “Sell” once the -8% point has been taken out in the “Off High” column. For more volatile sector ETFs, the trigger point is -10%.
In my advisor practice, we may or may not be invested in some of the 10 ETFs listed above.
3. Trend Tracking Indexes (TTIs)
Our TTIs improved again, as today’s hope rally ended up having staying power.
Here’s how we closed 04/08/2020:
Domestic TTI: -15.26% below its M/A (prior close -18.62%)—Sell signal effective 02/27/2020
International TTI: -16.18% below its M/A (prior close -17.17%)—Sell signal effective 02/26/2020
Disclosure: I am obliged to inform you that I, as well as my advisory clients, own some of the ETFs listed in the above table. Furthermore, they do not represent a specific investment recommendation for you, they merely show which ETFs from the universe I track are falling within the specified guidelines.
Contact Ulli