- Moving the markets
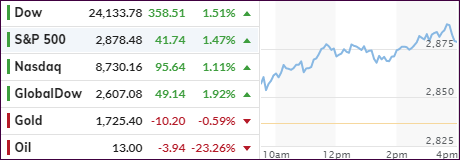
Despite weakness in the futures markets, the computer algos went to work this morning by pushing the major indexes to another green close with the S&P 500 gaining around +1.4%, while crude oil dumped -23%.
We saw two assists supporting equities.
One came from a giant short squeeze causing US stocks to surge, as Bloomberg’s chart shows. The other one, of a more global nature, came from BoJ’s promise to buy more assets, which pumped global markets, with especially the Nikkei being on fire.
This wiped out last week’s losses, as traders’ optimism about loosening restrictions took center stage, despite the usual warnings that such early moves could be premature and backfire.
The busiest week of the earnings season has started with negative news being widely expected, which is another reason why markets are in rally mode confirming once again that bad news can be good news. But for how long?
Guggenheim’s CIO Scott Minerd chimed in by saying:
“The central bank will never be able to get back to normal. The Fed’s balance sheet has expanded from $4.5 trillion to $6.6 trillion in just about a month, and it is likely on its way to over $9 trillion soon.”
With ZeroHedge concluding:
“And there you have it: the US is now (and has been for the past decade) just a more dignified form of USSR-style central planning, one where prices are set by decree and a decline in asset levels is prohibited for one simple reason: with financial assets over 6x global GDP, any crash in markets would result in a depression that would promptly spiral in social collapse.”
Words of wisdom indeed. In case you were wondering, this is exactly why markets are totally disconnected from any reality. Even the real economy, as demonstrated by crude oil, is disintegrating at the same time as earnings expectations are dumping, and not just in the US but globally as well.
This week is loaded with a variety of events, any of which could force the markets in either direction.
2. ETFs in the Spotlight
In case you missed the announcement and description of this section, you can read it here again.
It features some of the 10 broadly diversified domestic and sector ETFs from my HighVolume list as posted every Saturday. Furthermore, they are screened for the lowest MaxDD% number meaning they have been showing better resistance to temporary sell offs than all others over the past year.
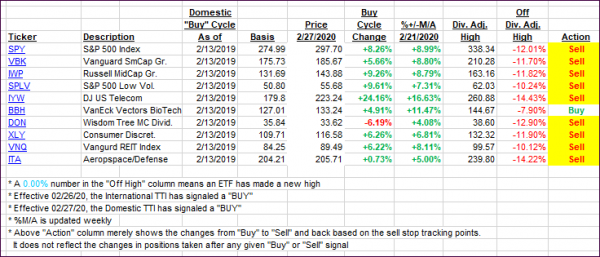
The below table simply demonstrates the magnitude with which these ETFs are fluctuating above or below their respective individual trend lines (%+/-M/A). A break below, represented by a negative number, shows weakness, while a break above, represented by a positive percentage, shows strength.
For hundreds of ETF choices, be sure to reference Thursday’s StatSheet.
For this past domestic “Buy” cycle, which ended on 2/27/2020, here’s how some our candidates have fared:

Click image to enlarge
Again, the %+/-M/A column above shows the position of the various ETFs in relation to their respective long-term trend lines, while the trailing sell stops are being tracked in the “Off High” column. The “Action” column will signal a “Sell” once the -8% point has been taken out in the “Off High” column. For more volatile sector ETFs, the trigger point is -10%.
In my advisor practice, we may or may not be invested in some of the 10 ETFs listed above.
3. Trend Tracking Indexes (TTIs)
Our TTIs improved as all around bad news turned out to be good news for the markets.
This is how we closed 04/27/2020:
Domestic TTI: -10.58% below its M/A (prior close -13.08%)—Sell signal effective 02/27/2020
International TTI: -12.85% below its M/A (prior close -14.46%)—Sell signal effective 02/26/2020
Disclosure: I am obliged to inform you that I, as well as my advisory clients, own some of the ETFs listed in the above table. Furthermore, they do not represent a specific investment recommendation for you, they merely show which ETFs from the universe I track are falling within the specified guidelines.
Contact Ulli