- Moving the markets
When I was watching the futures markets last night, I already knew that today would not be a good one to be in the markets. Despite the Fed unloading its biggest emergency bazooka ever, by announcing $700 billion in QE and a full 1% reduction in interest rates to “zero,” markets immediately went limit down.
We all know that the Fed’s FOMC meeting was scheduled for this coming Tuesday/Wednesday, and they could not wait 3 extra days to announce their decision?
So, they rushed to do it Sunday night just prior to the futures markets opening. This smelled like a panic move, and the markets took it as such and started the session limit down.
This morning, things did not look better, and the circuit breakers kicked in, as @GreekFire23 summed up:
- 9:30am: Ding Ding Ding! Trading open!
- 9:30:00001am: Halted
That represents the speed with which we hit limit down. In other words, Friday’s much hyped rebound turned into another dead-cat-bounce, with the major indexes getting slaughtered today by dropping around -12% with the Dow being the worst performer with -12.93%, or just about -3,000 points.
Or, looking at it from another viewpoint, Small Caps and Transportations are down -35% from their highs, and the rest of the majors down around -27%, according to ZH.
We have now seen 2 massive global monetary interventions, and they resulted in a total bloodbath for the markets—and this may only be the beginning.
The carnage was worldwide, with banking stocks in Europe now smashed to a level last seen in 1987, as Bloomberg shows.
The question now is, will the December 2018 lows of the S&P 500 hold? If not, we are bound to go a lot lower.
I am sure, this week will have a lot more surprises in store with many Buy-and-Holders wishing that they had joined us on the sidelines on 2/27.
2. ETFs in the Spotlight
In case you missed the announcement and description of this section, you can again.
It features 10 broadly diversified and sector ETFs from my HighVolume list as posted every Saturday. Furthermore, they are screened for the lowest MaxDD% number meaning they have been showing better resistance to temporary sell offs than all others over the past year.
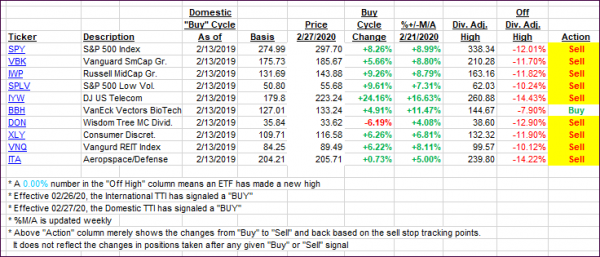
The below table simply demonstrates the magnitude with which some of the ETFs are fluctuating regarding their positions above or below their respective individual trend lines (%+/-M/A). A break below, represented by a negative number, shows weakness, while a break above, represented by a positive percentage, shows strength.
For hundreds of ETF choices, be sure to reference Thursday’s StatSheet.
For this past domestic “Buy” cycle, which ended on 2/27/2020, here’s how some our candidates have fared:

Click image to enlarge
Again, the %+/-M/A column above shows the position of the various ETFs in relation to their respective long-term trend lines, while the trailing sell stops are being tracked in the “Off High” column. The “Action” column will signal a “Sell” once the -8% point has been taken out in the “Off High” column. For more volatile sector ETFs, the trigger point is -10%.
3. Trend Tracking Indexes (TTIs)
Our TTIs imploded and have now reached such a deep level in bear market territory that I have never seen in 30 years. In other words, being in the market is utter insanity.
Here’s how we closed 03/16/2020:
Domestic TTI: -27.29% below its M/A (prior close -17.34%)—Sell signal effective 02/27/2020
International TTI: -26.59% below its M/A (prior close -20.01%)—Sell signal effective 02/26/2020
Disclosure: I am obliged to inform you that I, as well as my advisory clients, own some of the ETFs listed in the above table. Furthermore, they do not represent a specific investment recommendation for you, they merely show which ETFs from the universe I track are falling within the specified guidelines.
Contact Ulli