
- Moving the markets
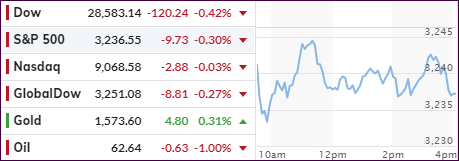
The major indexes opened lower and bobbed and weaved below their respective unchanged lines through the entire session, with only the Nasdaq spending some time above it, but it did not manage to hold on to early gains.
For sure, the ongoing concerns about a potential war in the Middle East have kept markets in check, but the selloffs have been minor, with dip buyers lurking on deck ready to pick up assets at lower prices.
Some MSM headlines have been screaming WW III for the past week and, while I am sure the tit for tat will continue, it’s unlikely that it will turn into a full-blown war, that is, if history is any indication. Over the past 200 years, Iranians have never started a war, although they have defended themselves on numerous occasions. I don’t see this changing, but you can never be certain.
During the recent moderate pullbacks, it has become clear that low volatility ETFs, like SPLV, which we own, have held up poorly. Case in point was today, when SPY gave back -0.28% while SPLV dropped -0.59%, or more than twice as much.
That has been a recurring and disturbing theme lately, which is why in my advisor practice we have lightened up considerably on its holdings and may shed even more. Something is simply wrong when an ETF does not live up to its functionality, namely showing improved resistance to sell-offs. For sure, SPLV has lost the luster shown during the first 9 months of 2019.
With earnings season not too far away, I am curious to see if a better 2020, as priced in last year, can become reality. If not, the savior for the bulls can always be Global Liquidity, as this chart shows.
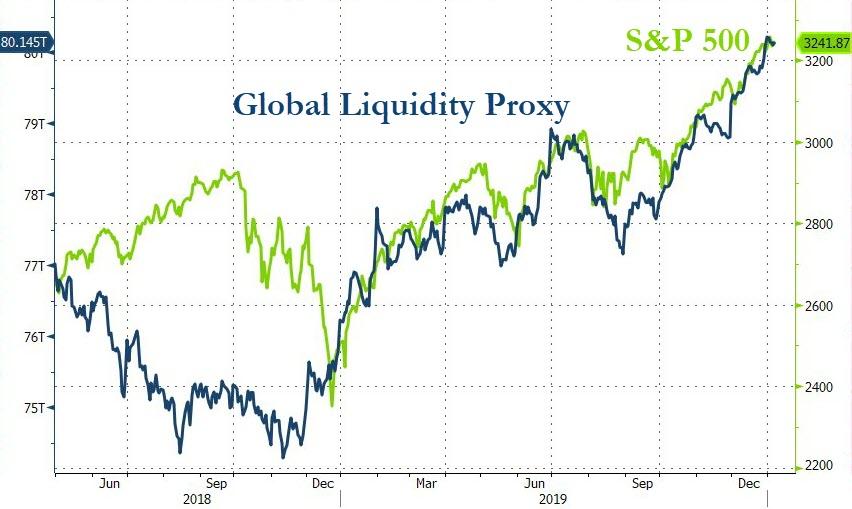
2. ETFs in the Spotlight
In case you missed the announcement and description of this section, you can again.
It features 10 broadly diversified and sector ETFs from my HighVolume list as posted every Saturday. Furthermore, they are screened for the lowest MaxDD% number meaning they have been showing better resistance to temporary sell offs than all others over the past year.
The below table simply demonstrates the magnitude with which some of the ETFs are fluctuating regarding their positions above or below their respective individual trend lines (%+/-M/A). A break below, represented by a negative number, shows weakness, while a break above, represented by a positive percentage, shows strength.
For hundreds of ETF choices, be sure to reference Thursday’s StatSheet.
For this current domestic “Buy” cycle, here’s how some our candidates have fared:
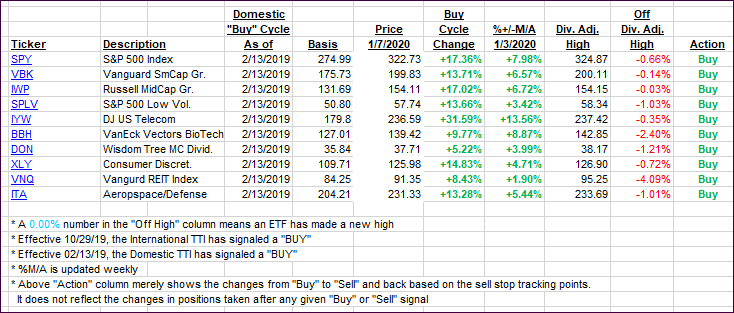
Click image to enlarge
Again, the %+/-M/A column above shows the position of the various ETFs in relation to their respective long-term trend lines, while the trailing sell stops are being tracked in the “Off High” column. The “Action” column will signal a “Sell” once the -8% point has been taken out in the “Off High” column. For more volatile sector ETFs, the trigger point is -10%.
3. Trend Tracking Indexes (TTIs)
Our Trend Tracking Indexes (TTIs) pulled back moderately, as the beating of war drums still kept the bulls in check.
Here’s how we closed 01/07/2020:
Domestic TTI: +7.20% above its M/A (prior close +7.29%)—Buy signal effective 02/13/2019
International TTI: +6.01% above its M/A (prior close +6.55%)—Buy signal effective 10/29/2019
Disclosure: I am obliged to inform you that I, as well as my advisory clients, own some of the ETFs listed in the above table. Furthermore, they do not represent a specific investment recommendation for you, they merely show which ETFs from the universe I track are falling within the specified guidelines.
Contact Ulli