- Moving the markets
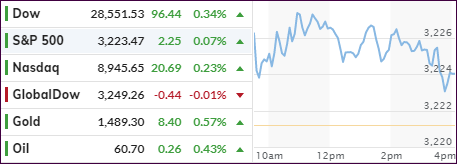
The Dow was the beneficiary of today’s news that Boeing’s CEO has “resigned” and was replaced by its current Chairman. This contributed at least 50 points to initial 100-point surge.
The major indexes crept into new record territory also supported by news that China intends cut its tariffs for pork, pharmaceuticals and some high-tech components starting January 1, 2020.
This appears to be the latest sign that US and China are finally serious in completing the partial trade agreement after 2 years of mudslinging and jawboning, which affected global and domestic economies. Maybe, just maybe, we are seeing some de-escalation of tensions.
In the domestic arena, we learned that Existing Home Sales unexpectedly slipped in November, while New Home Sales surprised to the upside with a +1.3% MoM gain. Durable Goods orders also did the unexpected, namely plunging -2% MoM vs. expectations of +1.5% MoM, which translates to a YoY breakdown of -5.7%; the worst since 2016.
But, most of those things no longer matter, and in the end, the major indexes eked out another gain, although on below average volume. The Dow lead the pack, while the S&P scored 8 record intraday highs in a row, its longest streak since 1998 (14 days).
The markets will have a shortened session tomorrow and on Thursday, so I will not write a commentary on those two days. However, I will post the StatSheet as usual and write Friday’s wrap up, which is then followed by the “ETFs on the Cutline” post on Saturday.
I wish you a Merry Christmas.
Ulli…
2. ETFs in the Spotlight
In case you missed the announcement and description of this section, you can read it here again.
It features 10 broadly diversified and sector ETFs from my HighVolume list as posted every Saturday. Furthermore, they are screened for the lowest MaxDD% number meaning they have been showing better resistance to temporary sell offs than all others over the past year.
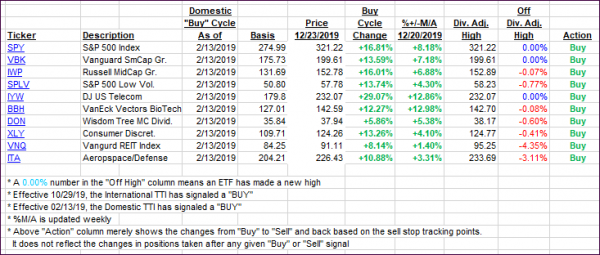
The below table simply demonstrates the magnitude with which some of the ETFs are fluctuating regarding their positions above or below their respective individual trend lines (%+/-M/A). A break below, represented by a negative number, shows weakness, while a break above, represented by a positive percentage, shows strength.
For hundreds of ETF choices, be sure to reference Thursday’s StatSheet.
For this current domestic “Buy” cycle, here’s how some our candidates have fared:

Click image to enlarge
Again, the %+/-M/A column above shows the position of the various ETFs in relation to their respective long-term trend lines, while the trailing sell stops are being tracked in the “Off High” column. The “Action” column will signal a “Sell” once the -8% point has been taken out in the “Off High” column. For more volatile sector ETFs, the trigger point is -10%.
3. Trend Tracking Indexes (TTIs)
Our Trend Tracking Indexes (TTIs) were mixed with the International one showing more strength.
Here’s how we closed 12/23/2019:
Domestic TTI: +7.41% above its M/A (prior close +7.79%)—Buy signal effective 02/13/2019
International TTI: +6.34% above its M/A (prior close +6.30%)—Buy signal effective 10/29/2019
Disclosure: I am obliged to inform you that I, as well as my advisory clients, own some of the ETFs listed in the above table. Furthermore, they do not represent a specific investment recommendation for you, they merely show which ETFs from the universe I track are falling within the specified guidelines.
Contact Ulli