
- Moving the markets
Last week’s rally was based on nothing more than rekindled optimism that the ever-accelerating trade war with China may be “again” on another verge of the warring parties agreeing to a ceasefire.
On the other hand, how many times can you cry “wolf” before it’s being ignored.
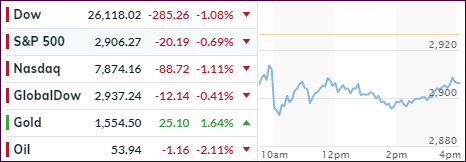
Apparently, we have not reached that moment in time yet, as on Sunday morning, against all wishful thinking, the US slapped tariffs on $112 billion in Chinese imports. It only took 1 minute for China to retaliate via higher tariffs on some $75 billion of US goods.
That killed the “trade deal is imminent” proposition, and it became clear that Tuesday’s market reaction would be a negative one, and that’s exactly what happened.
Assisting the sour mood of traders and algos alike was a report showing that US manufacturing is the weakest in 10 years, and the headline manufacturing number plunged into contraction.
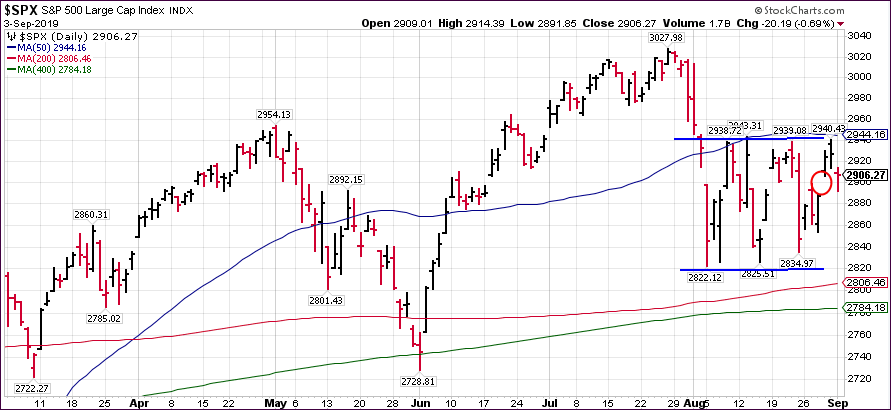
At its lowest point, the Dow was down over 300 points, and the S&P 500 almost closed the breakaway gap I mentioned last Thursday, while the index seems to be heading towards the lower band of the 5-week trading range.
With the slippage of the markets, it appears that there may be some recoupling of stocks and bond yields in the near future, as the jaw of death has closed slightly—and not in favor of stocks.
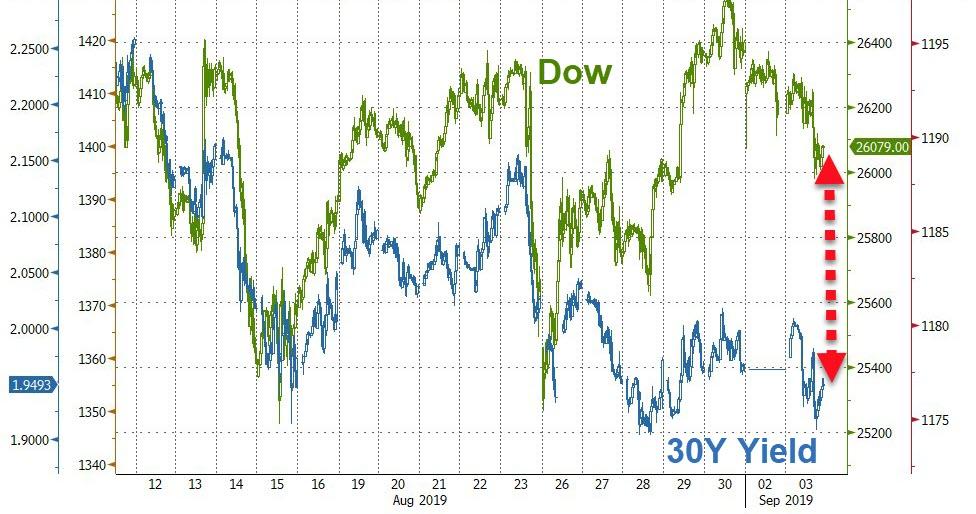
We will find out soon enough if that tendency continues.
2. ETFs in the Spotlight
In case you missed the announcement and description of this section, you can read it here again.
It features 10 broadly diversified and sector ETFs from my HighVolume list as posted every Saturday. Furthermore, they are screened for the lowest MaxDD% number meaning they have been showing better resistance to temporary sell offs than all others over the past year.
The below table simply demonstrates the magnitude with which some of the ETFs are fluctuating regarding their positions above or below their respective individual trend lines (%+/-M/A). A break below, represented by a negative number, shows weakness, while a break above, represented by a positive percentage, shows strength.
For hundreds of ETF choices, be sure to reference Thursday’s StatSheet.
For this current domestic “Buy” cycle, here’s how some our candidates have fared:
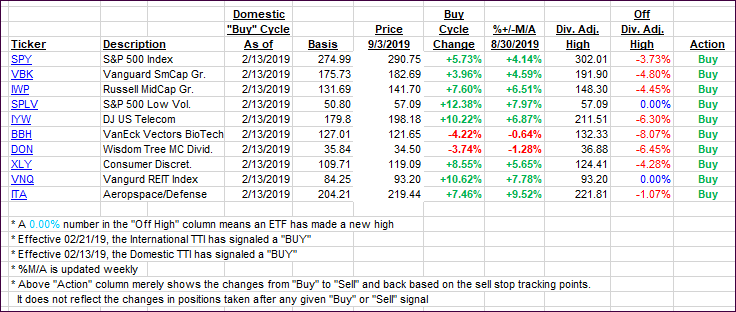
Again, the %+/-M/A column above shows the position of the various ETFs in relation to their respective long-term trend lines, while the trailing sell stops are being tracked in the “Off High” column. The “Action” column will signal a “Sell” once the -8% point has been taken out in the “Off High” column. For more volatile sector ETFs, the trigger point is -10%.
3. Trend Tracking Indexes (TTIs)
Our Trend Tracking Indexes (TTIs) headed south as Sunday’s trade deal disappointment pulled the markets down.
Here’s how we closed 09/03/2019:
Domestic TTI: +1.78% above its M/A (prior close +2.36%)—Buy signal effective 02/13/2019
International TTI: -1.11% below its M/A (prior close -0.63%)—Sell signal effective 08/15/2019
Disclosure: I am obliged to inform you that I, as well as my advisory clients, own some of the ETFs listed in the above table. Furthermore, they do not represent a specific investment recommendation for you, they merely show which ETFs from the universe I track are falling within the specified guidelines.
Contact Ulli