
1. Moving the markets
After sleeping on the Fed’s statement on interest rates, Wall Street traders decided that the Fed left the door somewhat open to a rate cut. As a result, expectations soared from 80% to 100% that the Fed will “cut” in July.
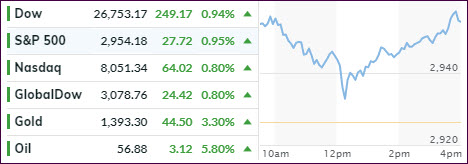
That was enough for the major indexes to gap higher at the opening with the S&P 500 setting a new intra-day all-time high in the process, while taking another giant step towards conquering its $3k milestone marker.
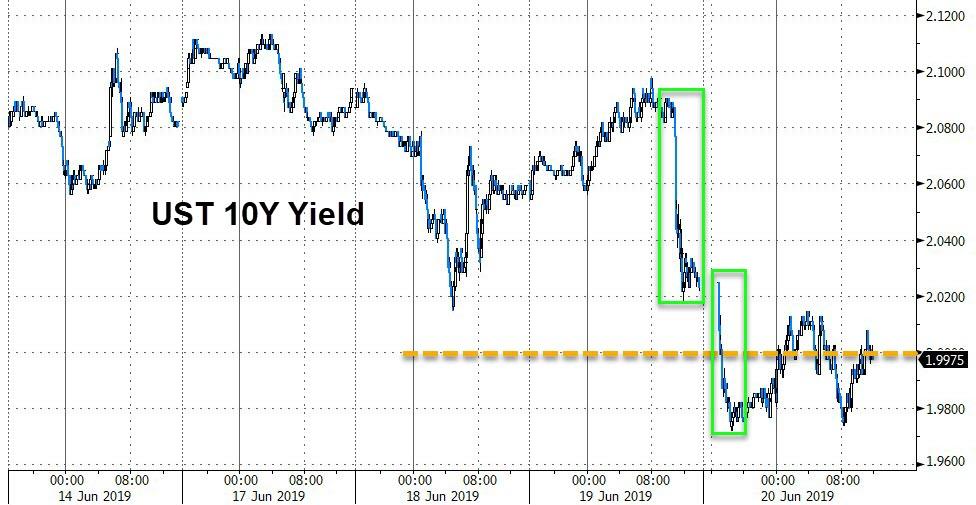
A mid-day dip did nothing but encourage more bulls to jump aboard this pause in upside momentum, and up we went notching new highs for the session prior to the close. Bond yields headed lower again, with the 10-year barely hanging on to the 2% level, although it dipped below it intra-day.
While most of the attention was on the Fed, it’s important to note that tomorrow is quadruple option expirations day, which can cause the markets to move violently in either direction prior to expiration time. I think a great deal of today’s upward ammo came from that looming deadline.
Also helping today’s bullish cause was a report that the warring parties in the U.S.-China trade dispute have decided to get together again, with the U.S. delegation traveling to Japan next week for “preliminary” meetings.
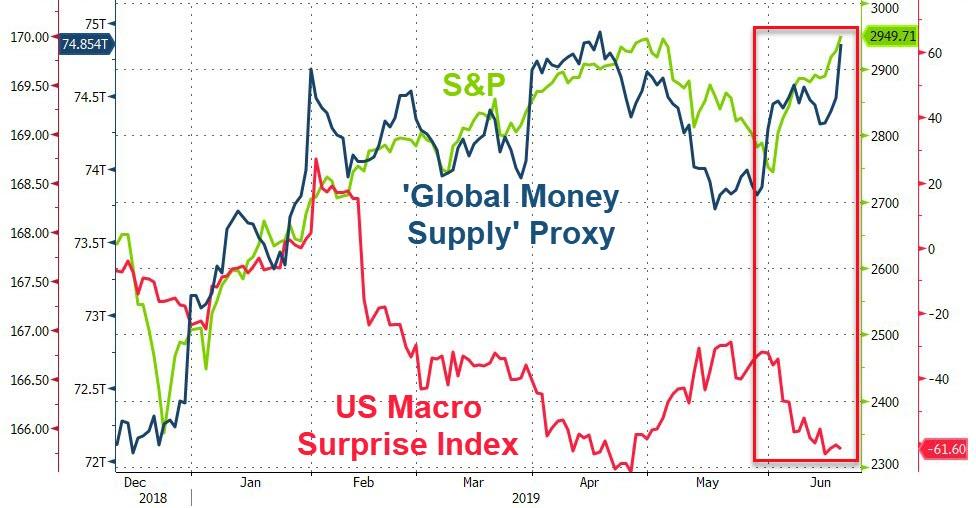
As I have posted before, the rise of the global money supply has been a terrific indicator as to the overall direction of equities. It has surged once again and has been a major contributor to rescuing the markets after the very destructive month of May, during which the S&P 500 lost -6.6%.
2. ETFs in the Spotlight
In case you missed the announcement and description of this section, you can read it here again.
It features 10 broadly diversified and sector ETFs from my HighVolume list as posted every Saturday. Furthermore, they are screened for the lowest MaxDD% number meaning they have been showing better resistance to temporary sell offs than all others over the past year.
The below table simply demonstrates the magnitude with which some of the ETFs are fluctuating regarding their positions above or below their respective individual trend lines (%+/-M/A). A break below, represented by a negative number, shows weakness, while a break above, represented by a positive percentage, shows strength.
For hundreds of ETF choices, be sure to reference Thursday’s StatSheet.
For this current domestic “Buy” cycle, here’s how some our candidates have fared:
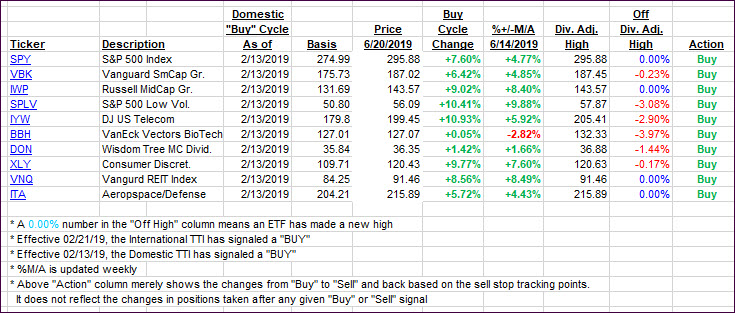
Again, the %+/-M/A column above shows the position of the various ETFs in relation to their respective long-term trend lines, while the trailing sell stops are being tracked in the “Off High” column. The “Action” column will signal a “Sell” once the -8% point has been taken out in the “Off High” column. For more volatile sector ETFs, the trigger point is -10%.
3. Trend Tracking Indexes (TTIs)
Our Trend Tracking Indexes (TTIs) jumped and moved deeper into bullish territory.
Here’s how we closed 06/20/2019:
Domestic TTI: +6.73% above its M/A (last close +5.80%)—Buy signal effective 02/13/2019
International TTI: +4.16% above its M/A (last close +3.33%)—Buy signal effective 06/19/2019
Disclosure: I am obliged to inform you that I, as well as my advisory clients, own some of the ETFs listed in the above table. Furthermore, they do not represent a specific investment recommendation for you, they merely show which ETFs from the universe I track are falling within the specified guidelines.
Contact Ulli