- Moving the markets
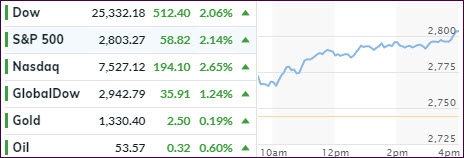
A couple of positive developments combined forces to help the market crawl out of a hole and ramp higher after the miserable month of May. The major indexes gained above 2%.
Getting things started right at the opening were these conciliatory words from China in regards to the recent trade war escalation:
- CHINA HOPES U.S. TO STOP WRONG DOINGS, MEET CHINA HALFWAY
- CHINA COMMERCE MINISTRY SAYS THE DIFFERENCES AND FRICTIONS BETWEEN CHINA AND THE U.S. SHOULD BE RESOLVED THROUGH DIALOGUE AND NEGOTIATIONS
That was enough meat on the trade bone for the headline-scanning computer algos to send stocks sharply on a northerly direction. Along that path, we witnessed the biggest short-squeeze since the first week of 2019.
To support an already positive day for the bulls, Fed chief Powell was interpreted by some traders as having admitted to open the door to a rate cut. He said that the Fed would “act as appropriate” to sustain the expansion. These remarks came after Fed President Bullard uttered on Monday that rate cuts “may be warranted soon” given the international trade disputes.
That’s all it took to push equities out of the doldrums, even as economic data points were anything but positive. We saw that global manufacturing contracted to a 7-year low, while U.S. factory orders showed the slowest growth since Trump’s election.
The S&P 500 managed to not only reclaim its 2,800 level but also its technically important 200-day M/A. The Dow climbed back above its 25k milestone marker, while the Nasdaq ended up wiping out some of its recent losses.
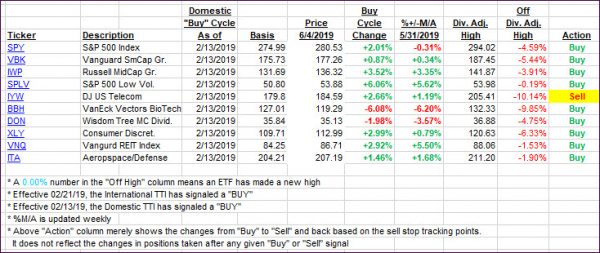
Lagging behind the S&P 500 today, but remaing ahead during this current Domestic Buy cycle, was the low volatilty ETF SPLV, which performs better when markets are mired in uncertainty and not shoot straight up, as we saw today.
At least for the moment, our Domestic TTI moved back into bullish territory after having danced around its trend line for the past week. The question remains as to whether today was an outlier or the resumption of the interrupted uptrend.
2. ETFs in the Spotlight
In case you missed the announcement and description of this section, you can read it here again.
It features 10 broadly diversified and sector ETFs from my HighVolume list as posted every Saturday. Furthermore, they are screened for the lowest MaxDD% number meaning they have been showing better resistance to temporary sell offs than all others over the past year.
The below table simply demonstrates the magnitude with which some of the ETFs are fluctuating regarding their positions above or below their respective individual trend lines (%+/-M/A). A break below, represented by a negative number, shows weakness, while a break above, represented by a positive percentage, shows strength.
For hundreds of ETF choices, be sure to reference Thursday’s StatSheet.
For this current domestic “Buy” cycle, here’s how some our candidates have fared:

Again, the %+/-M/A column above shows the position of the various ETFs in relation to their respective long-term trend lines, while the trailing sell stops are being tracked in the “Off High” column. The “Action” column will signal a “Sell” once the -8% point has been taken out in the “Off High” column. For more volatile sector ETFs, the trigger point is -10%.
3. Trend Tracking Indexes (TTIs)
Our Trend Tracking Indexes (TTIs) headed north with the Domestic one settling back in bullish territory.
Here’s how we closed 06/04/2019:
Domestic TTI: +2.17% above its M/A (last close -0.07%)—Buy signal effective 02/13/2019
International TTI: -0.55% below its M/A (last close -1.76%)—Sell signal effective 05/30/2019
Disclosure: I am obliged to inform you that I, as well as my advisory clients, own some of the ETFs listed in the above table. Furthermore, they do not represent a specific investment recommendation for you, they merely show which ETFs from the universe I track are falling within the specified guidelines.
Contact Ulli