
ETF Tracker StatSheet
WEEK ENDS WITH REALITY CHECK

- Moving the markets
Reality made its way into the stock market with the major indexes plunging at first then staging a mid-day comeback only to dump again and close at the lows of the session.
As I pointed out yesterday, the Fed’s extreme dovish stance, along with worries about plunging yields, made traders ponder “what do they know that we don’t?” It appears that the answer can be found in a global slowing economy along with deteriorating data points.
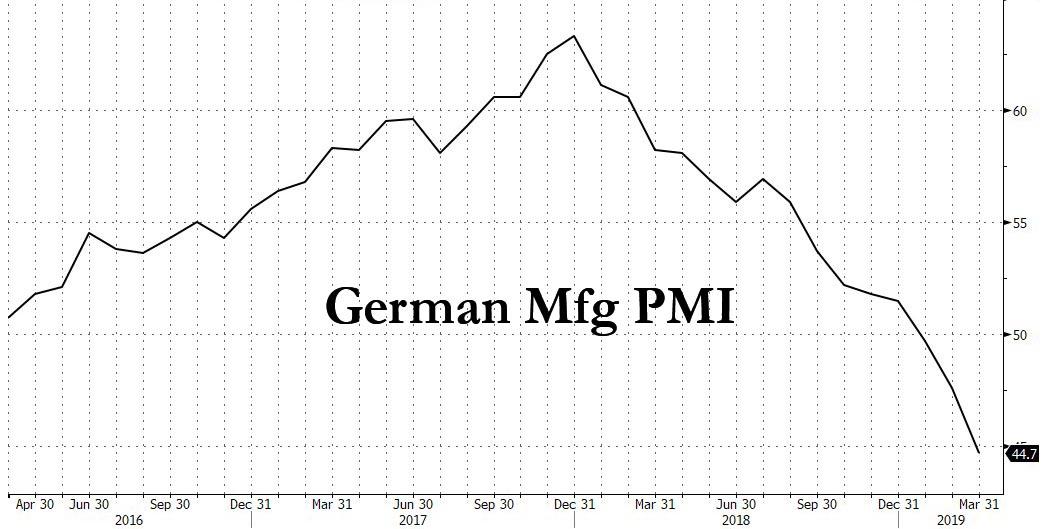
Europe started today’s carnage when Germany’s manufacturing PMI crashed to 44.7 from 47.6, while economists were expecting a modest rebound to 48. That is now the third consecutive reading below 50, which indicates not only contraction but a recession as well.
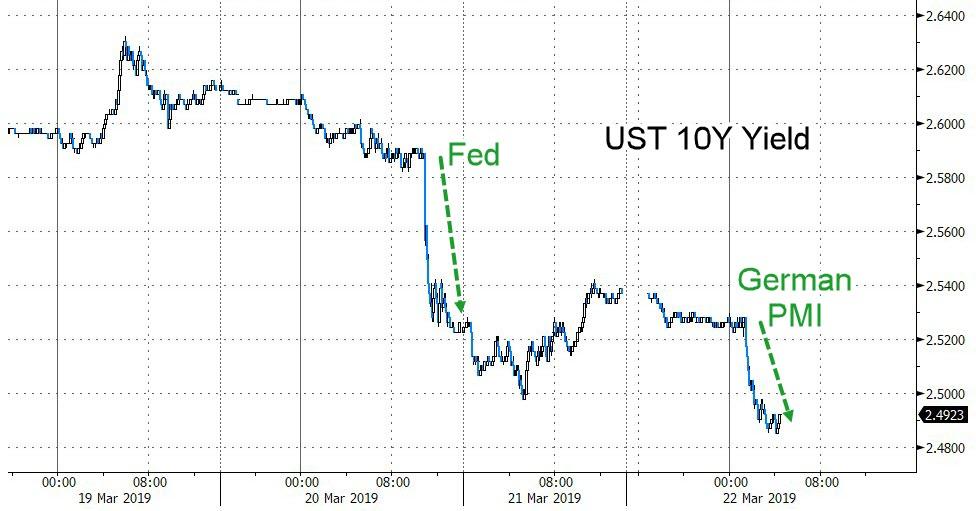
This was followed by the U.S. Manufacturing PMI plunging to a 21-month low of 52 from 53 against expectations of 53.5, while the services PMI came in at 54.8 from 56 vs. expectations of 55.5. Maybe traders are now less puzzled as to why the European Central Bank (ECB) displayed an extreme dovish stance, just a few days before the Fed followed suit.
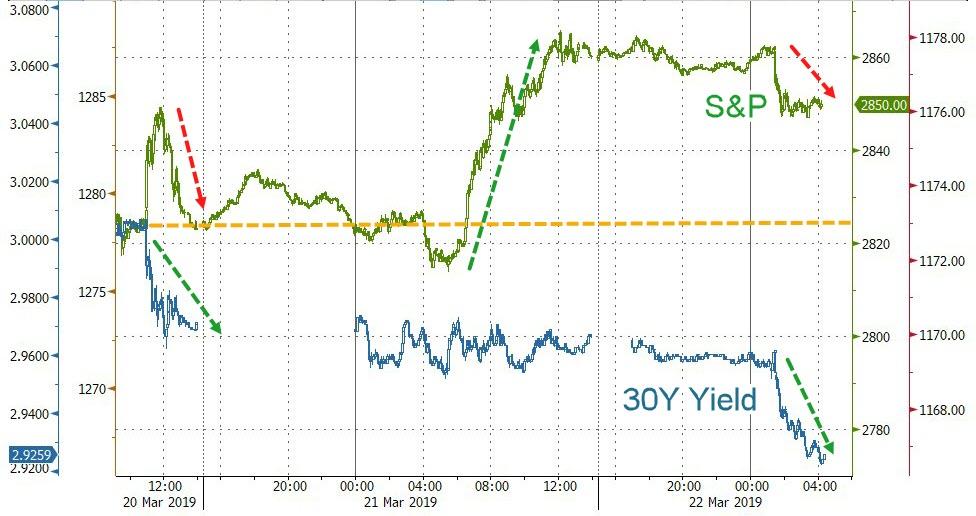
This one-two punch caused yields to drop sharply with the widely followed 10-year bond closing down a whopping 9.3 basis points to 2.44%.
In fact, according to ZH, the yield curve is now inverted for the first time since 2007:
On six occasions over the past 50 years when the three-month yield exceeded that of the 10-year, economic recession invariably followed, commencing an average of 311 days after the initial signal.
While equity markets have been downright ignorant of this development, as well as the massive decoupling between stocks and bonds, today may have been a wake-up call. Well-known fund manager Jeff Gundlach had this to say:
“Just because things seem invincible doesn’t mean they are invincible. There is kryptonite everywhere. Yesterday’s move created more uncertainty.”
This makes it one more reason while it is critical for your financial well-being to have an exit strategy in place, despite the prevailing bullish sentiment.
Why?
Because, as we saw last October, market direction can unexpectedly change in no time, not only due to worldwide uncertainties but also because all bullish cycles will come to an end—eventually; and this one is way past its due date.
- ETFs in the Spotlight
In case you missed the announcement and description of this section, you can read it here again.
It features 10 broadly diversified and sector ETFs from my HighVolume list as posted every Saturday. Furthermore, they are screened for the lowest MaxDD% number meaning they have been showing better resistance to temporary sell offs than all others over the past year.
The below table simply demonstrates the magnitude with which some of the ETFs are fluctuating regarding their positions above or below their respective individual trend lines (%+/-M/A). A break below, represented by a negative number, shows weakness, while a break above, represented by a positive percentage, shows strength.
For hundreds of ETF choices, be sure to reference Thursday’s StatSheet.
For this current domestic “Buy” cycle, here’s how some our candidates have fared:
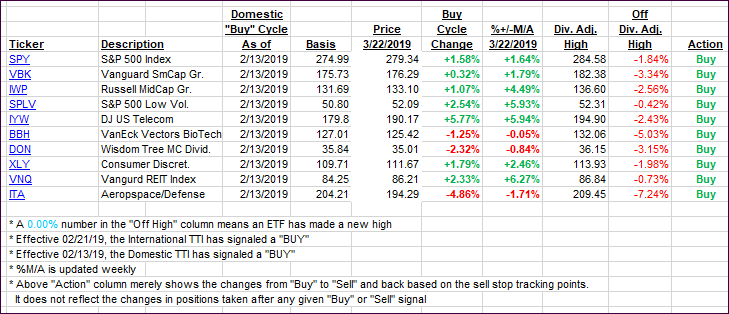
Again, the %+/-M/A column above shows the position of the various ETFs in relation to their respective long-term trend lines, while the trailing sell stops are being tracked in the “Off High” column. The “Action” column will signal a “Sell” once the -8% point has been taken out in the “Off High” column. For more volatile sector ETFs, the trigger point is -10%.
- Trend Tracking Indexes (TTIs)
Our Trend Tracking Indexes (TTIs) took a steep dive in sync with today’s bearish theme. They remain, however, on the bullish side of respective trend lines.
Here’s how we closed 03/22/2019:
Domestic TTI: +1.96% above its M/A (last close +3.65%)—Buy signal effective 02/13/2019
International TTI: +1.08% above its M/A (last close +2.77%)—Buy signal effective 02/21/2019
Disclosure: I am obliged to inform you that I, as well as my advisory clients, own some of the ETFs listed in the above table. Furthermore, they do not represent a specific investment recommendation for you, they merely show which ETFs from the universe I track are falling within the specified guidelines.
———————————————————-
WOULD YOU LIKE TO HAVE YOUR INVESTMENTS PROFESSIONALLY MANAGED?
Do you have the time to follow our investment plans yourself? If you are a busy professional who would like to have his portfolio managed using our methodology, please contact me directly or get more details at:
https://theetfbully.com/personal-investment-management/
———————————————————
Back issues of the ETF/No Load Fund Tracker are available on the web at:
https://theetfbully.com/newsletter-archives/
Contact Ulli