
- Moving the markets
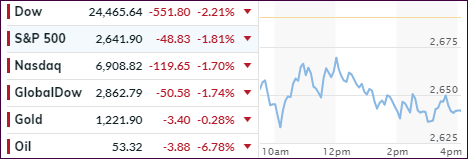
If you had expected a bounce after yesterday’s drubbing, you would have been wrong. This morning’s opening happened deeply in the red with the Dow being down some 600 points, a level from which it rebounded only to visit the -640 level later in the session. While the major indexes managed to crawl off their worst levels of the day, it did not matter, since the bears were in charge and ruled over the inevitable outcome.
Tech heavyweight Apple, which was down at one point around 10%, also managed a comeback to close the session with “only” a -4.78% loss. In part, the punishment came in view of Apple’s disappointing Holiday season guidance. The FANGs in general are not only stuck in a bear market but haven given back just about all of this year’s gains after having collapsed to January’s levels.
The red numbers were not limited to just domestic equities. Global markets, including all of Europe and Asia, demonstrated that the current bearish tendencies may be here to stay—or even get worse. Europe’s main index, the STOXX 600, dropped to its lowest close in 2 years.
Technically speaking, many support levels have been or about to be violated giving more credence to the fact that the bear market may only be in its beginning stages. Obviously, there will rebounds as dip-buyers step in to drive the markets back up, but the major trend is down as our Trend Tracking Indexes (section 3) show.
This is not the time to be a hero by trying to catch a falling knife; this is the time to be in cash and waiting patiently on the sidelines for a resumption of the bull market, whenever our indexes generate the signal to move back in.
- ETFs in the Spotlight
In case you missed the announcement and description of this section, you can read it here again.
It features 10 broadly diversified and sector ETFs from my HighVolume list as posted every Saturday. Furthermore, they are screened for the lowest MaxDD% number meaning they have been showing better resistance to temporary sell offs than all others over the past year.
The below table simply demonstrates the magnitude with which some of the ETFs are fluctuating regarding their positions above or below their respective individual trend lines (%M/A). A break below, represented by a negative number, shows weakness, while a break above, represented by a positive percentage, shows strength.
For hundreds of ETF choices, be sure to reference Thursday’s StatSheet.
Year to date, here’s how our original candidates have fared:
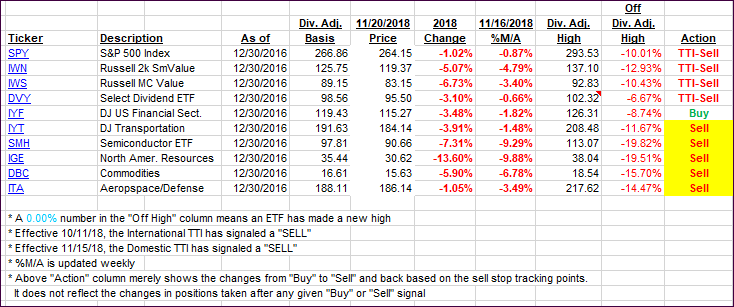
Again, the %M/A column above shows the position of the various ETFs in relation to their respective long-term trend lines, while the trailing sell stops are being tracked in the “Off High” column. The “Action” column will signal a “Sell” once the -8% point has been taken out in the “Off High” column. For more volatile sector ETFs, the trigger point is -10%.
- Trend Tracking Indexes (TTIs)
Our Trend Tracking Indexes (TTIs) plunged as the bearish momentum accelerated. It’s good to be on the sidelines.
Here’s how we closed 11/20/2018:
Domestic TTI: -4.06% below its M/A (last close -2.35%)—Sell signal effective 11/15/2018
International TTI: -5.87% below its M/A (last close -4.23%)—Sell signal effective 10/11/2018
Disclosure: I am obliged to inform you that I, as well as my advisory clients, own some of the ETFs listed in the above table. Furthermore, they do not represent a specific investment recommendation for you, they merely show which ETFs from the universe I track are falling within the guidelines specified.
Contact Ulli