- Moving the markets
Despite several attempts to pull the major markets out of yesterday’s hole, the efforts failed with the Dow and S&P 500 sinking moderately while the Nasdaq ended the session unchanged. Not helping matters was the fact that oil prices tumbled -8.11% and ended up barely hanging on to the 55-handle after having now fallen for a record 12th day. Ouch!
The reason is not that far fetched in that I believe this trend is a sign of a sluggish or even reversing global expansion. We’ll have to watch and see if this turns out to be a canary in the coalmine as far as the future direction of equities is concerned.
The initial market levitation was helped by news that China’s top trade negotiator is set to meet Mnuchin in Washington later this month to work on resolving the trade dispute. That headline was later questioned due to lack of information about concrete steps which, as we’ve seen many times before, resulted in the markets losing their early upward momentum and south we went, while dip buyers were still conspicuously absent.
Stock specific news did nothing to encourage any bullish behavior. While GE’s stock finally bounced back, its bonds did not and moved into junk territory. Heavyweight Apple slipped back below its 200-day M/A and gave back 1% on the day. The FANGs had an early bounce but closed unchanged.
In the end, it was a day that offered no clue whatsoever as to future market direction. We remain on standby with our next potential domestic “Sell” signal and will act once we get a better clue as to where things are headed next.
- ETFs in the Spotlight
In case you missed the announcement and description of this section, you can read it here again.
It features 10 broadly diversified and sector ETFs from my HighVolume list as posted every Saturday. Furthermore, they are screened for the lowest MaxDD% number meaning they have been showing better resistance to temporary sell offs than all others over the past year.
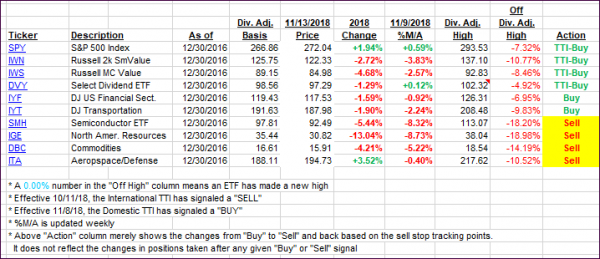
The below table simply demonstrates the magnitude with which some of the ETFs are fluctuating regarding their positions above or below their respective individual trend lines (%M/A). A break below, represented by a negative number, shows weakness, while a break above, represented by a positive percentage, shows strength.
For hundreds of ETF choices, be sure to reference Thursday’s StatSheet.
Year to date, here’s how our candidates have fared so far:
Again, the %M/A column above shows the position of the various ETFs in relation to their respective long-term trend lines, while the trailing sell stops are being tracked in the “Off High” column. The “Action” column will signal a “Sell” once the -8% point has been taken out in the “Off High” column. For more volatile sector ETFs, the trigger point is -10%.
- Trend Tracking Indexes (TTIs)
Our Trend Tracking Indexes (TTIs) changed only immaterially. We’re still waiting to see in which direction the breakout will take us and if it will validate a new “Sell” signal.
Here’s how we closed 11/13/2018:
Domestic TTI: -1.56% below its M/A (last close -1.52%)—Buy signal effective 11/08/2018
International TTI: -4.44% below its M/A (last close -4.55%)—Sell signal effective 10/11/2018
Disclosure: I am obliged to inform you that I, as well as my advisory clients, own some of the ETFs listed in the above table. Furthermore, they do not represent a specific investment recommendation for you, they merely show which ETFs from the universe I track are falling within the guidelines specified.
Contact Ulli

