
- Moving the Markets
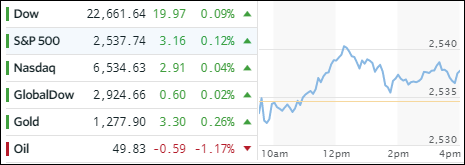
Even though today’s gains were modest, they were gains nonetheless. The major indexes continued their ascent into record territory despite a slow start right after the opening. However, in the end, the S&P 500 posted its sixth consecutive day of gains.
Private sector employment slowed from September with 150k jobs added. All eyes are now on Friday’s nonfarm payroll report, the outcome of which could drive markets higher. On the other hand, no matter what the number, the markets may rally anyway; it’s just the “new normal” type of environment we’re in.
The shocker of the day and the moment of truth came from SmallCaps, which actually ended the day lower with the Russell 2000 diving an incredible -0.25%, its worst drop in over a month… of course, I am being facetious…
In ETF land, the picture was mixed but the outcome of the session was overall positive. The Aerospace and Defense ETF (ITA) came in first place with a gain of +0.31%. Second place was a tie with Semiconductors (SMH) and Emerging Markets (SCHE) each adding +0.15%. Closing in the red was the Transportation Index (IYT) with -0.49% and US SmallCaps (SCHA) with -0.22%.
Interest rates changed immaterially, gold edged higher, oil slipped back below $50, and the US dollar (UUP) pulled back a tiny -0.12%.
- ETFs in the Spotlight (updated for 2017)
In case you missed the announcement and description of this section, you can read it here again.
It features 10 broadly diversified and sector ETFs from my HighVolume list as posted every Saturday. Furthermore, they are screened for the lowest MaxDD% number meaning they have been showing better resistance to temporary sell offs than all others over the past year.
The below table simply demonstrates the magnitude with which some of the ETFs are fluctuating in regards to their positions above or below their respective individual trend lines (%M/A). A break below, represented by a negative number, shows weakness, while a break above, represented by a positive percentage, shows strength.
For hundreds of ETF choices, be sure to reference Thursday’s StatSheet.
Year to date, here’s how the 2017 candidates have fared so far:
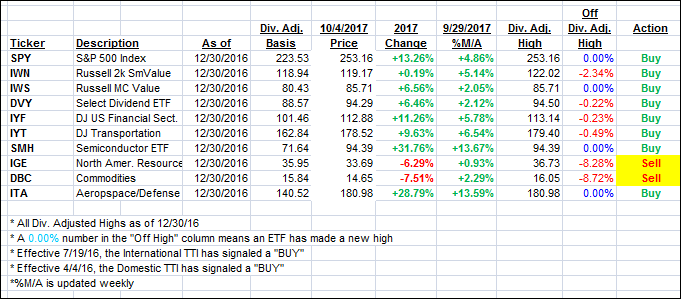
Again, the %M/A column above shows the position of the various ETFs in relation to their respective long term trend lines, while the trailing sell stops are being tracked in the “Off High” column. The “Action” column will signal a “Sell” once the -7.5% point has been taken out in the “Off High” column.
- Trend Tracking Indexes (TTIs)
Our Trend Tracking Indexes (TTIs) crawled higher but by only a fraction of a percent.
Here’s how we closed 10/4/2017:
Domestic TTI: +3.07% (last close +3.03%)—Buy signal effective 4/4/2016
International TTI: +7.22% (last close +7.10%)—Buy signal effective 7/19/2016
Disclosure: I am obliged to inform you that I, as well as my advisory clients, own some of the ETFs listed in the above table. Furthermore, they do not represent a specific investment recommendation for you, they merely show which ETFs from the universe I track are falling within the guidelines specified.
Contact Ulli