
- Moving the Markets
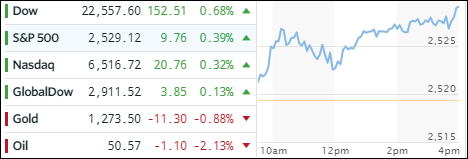
Right now, it seems that nothing can stop the northerly path of equities. Despite the police brutality associated with the Catalonian secession vote in Spain over the weekend and last night’s mass shooting in Las Vegas, the major indexes started the day in positive territory and resumed a steady run-up throughout the session. New records were set for the Dow, Nasdaq, S&P 500 and Russell 2000.
It appears the main driving force is nothing but unbridled optimism about the fourth quarter along with high earnings expectations for the just passed third quarter. Despite doubts as to whether Trump’s tax plan can still be voted on and/or passed this year, in its current form, the fact that this plan even exists seems enough to wet a trader’s bullish appetite.
In regards to ETFs, we saw SmallCaps (SCHA) taking the lead with a solid gain of +1.11% followed by MidCaps (SCHM) with +0.64%. Not crossing the unchanged line to the upside were Transportations (IYT) and Emerging Markets (SCHE) with tiny losses of -0.15% and -0.07% respectively. Interest rates rose with the yield on the 10-year Treasury bond climbing 2 basis points to 2.33%. That caused the US Dollar (UUP) to gap higher +0.58%; a level that is now clearly above its 50-day M/A and indicates a short-term uptrend.
- ETFs in the Spotlight (updated for 2017)
In case you missed the announcement and description of this section, you can read it here again.
It features 10 broadly diversified and sector ETFs from my HighVolume list as posted every Saturday. Furthermore, they are screened for the lowest MaxDD% number meaning they have been showing better resistance to temporary sell offs than all others over the past year.
The below table simply demonstrates the magnitude with which some of the ETFs are fluctuating in regards to their positions above or below their respective individual trend lines (%M/A). A break below, represented by a negative number, shows weakness, while a break above, represented by a positive percentage, shows strength.
For hundreds of ETF choices, be sure to reference Thursday’s StatSheet.
Year to date, here’s how the 2017 candidates have fared so far:
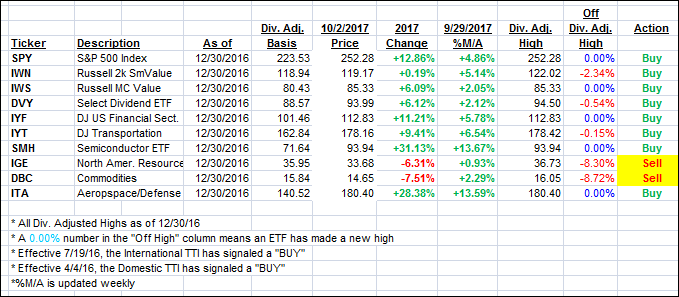
Again, the %M/A column above shows the position of the various ETFs in relation to their respective long term trend lines, while the trailing sell stops are being tracked in the “Off High” column. The “Action” column will signal a “Sell” once the -7.5% point has been taken out in the “Off High” column.
- Trend Tracking Indexes (TTIs)
Our Trend Tracking Indexes (TTIs) headed north as the major indexes continued their ascent into record territory.
Here’s how we closed 10/2/2017:
Domestic TTI: +2.90% (last close +2.74%)—Buy signal effective 4/4/2016
International TTI: +6.79% (last close +6.71%)—Buy signal effective 7/19/2016
Disclosure: I am obliged to inform you that I, as well as my advisory clients, own some of the ETFs listed in the above table. Furthermore, they do not represent a specific investment recommendation for you, they merely show which ETFs from the universe I track are falling within the guidelines specified.
Contact Ulli