
- Moving the Markets
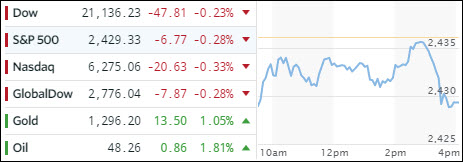
For the second day, market nervousness prevailed, as concerns ahead of the UK general election, uncertainties about ex-FBI chief Comey’s upcoming testimony to the Senate, along with a Thursday ECB policy meeting, kept the major indexes subdued and stuck below their respective unchanged lines. However, as was the case yesterday, the pullback was minor.
Interest rates took another dive with the 10-year T-Bond losing 4 basis points to now yield +2.14%, which is a substantial drop from the beginning of March 2017 when the yield had reached +2.62%. What does it mean? Simple, if yields slide at this pace, it usually is a sign that the economy is heading towards a recession which, when reviewing the downright atrocious and worsening economic data points, appears to be a reasonable conclusion. The question seems to be not “if” but “when.”
The US dollar (UUP) followed suit by slipping -0.24% to a level last seen early October 2016. As is no surprise, this weakness has benefited gold, which is now in striking distance of reclaiming the $1,300 marker, which is a number gold has not been able to reach since around Election Day.
- ETFs in the Spotlight (updated for 2017)
In case you missed the announcement and description of this section, you can read it here again.
It features 10 broadly diversified and sector ETFs from my HighVolume list as posted every Saturday. Furthermore, they are screened for the lowest MaxDD% number meaning they have been showing better resistance to temporary sell offs than all others over the past year.
The below table simply demonstrates the magnitude with which some of the ETFs are fluctuating in regards to their positions above or below their respective individual trend lines (%M/A). A break below, represented by a negative number, shows weakness, while a break above, represented by a positive percentage, shows strength.
For hundreds of ETF choices, be sure to reference Thursday’s StatSheet.
Year to date, here’s how the 2017 candidates have fared so far:
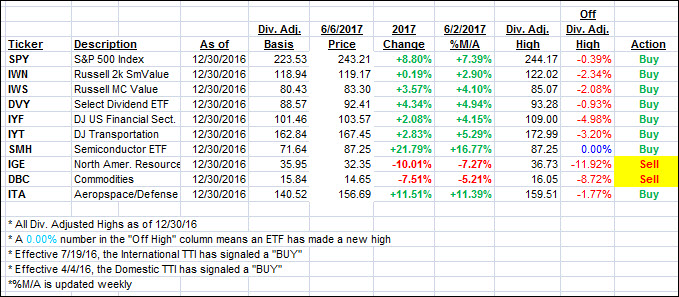
Again, the %M/A column above shows the position of the various ETFs in relation to their respective long term trend lines, while the trailing sell stops are being tracked in the “Off High” column. The “Action” column will signal a “Sell” once the -7.5% point has been taken out in the “Off High” column.
- Trend Tracking Indexes (TTIs)
Our Trend Tracking Indexes (TTIs) pulled back again as uncertainty kept upward momentum in check.
Here’s how we closed 6/6/2017:
Domestic TTI: +4.02% (last close +4.09%)—Buy signal effective 4/4/2016
International TTI: +8.42% (last close +8.76%)—Buy signal effective 7/19/2016
Disclosure: I am obliged to inform you that I, as well as my advisory clients, own some of the ETFs listed in the above table. Furthermore, they do not represent a specific investment recommendation for you, they merely show which ETFs from the universe I track are falling within the guidelines specified.
Contact Ulli