
ETF Tracker StatSheet
https://theetfbully.com/2017/06/weekly-statsheet-etf-tracker-newsletter-updated-06222017/
EKING OUT A TINY GAIN
- Moving the Markets
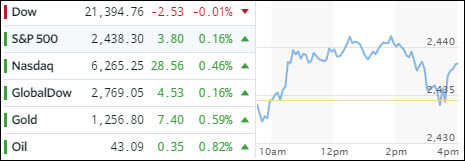
Another roller coaster day ended just about at the unchanged line for the Dow with the S&P 500 and Nasdaq managing to climb back into positive territory. For the week, the story was very similar with only the Nasdaq scoring a newsworthy gain of +1.8%.
The financial sector (XLF) slipped -0.4% with the Regional Banking ETF (KRE) also surrendering -0.64%, despite the Fed’s release of the results of stress tests on the health of the banking sector touting “that all 34 banks assessed to have strong levels of capital and would be able to keep lending even during a severe recession.”
For the week, healthcare (biotech) and technology were the winners while energy and financials were the laggards. Interest rates dropped this week with the 10-year bond ending the day unchanged at 2.15%. The US Dollar ETF (UUP) ended up slightly higher for the past 5 trading sessions but closed down the last 3 days in a row helping gold squeeze out a small gain and climb back above its 200-day M/A.
- ETFs in the Spotlight (updated for 2017)
In case you missed the announcement and description of this section, you can read it here again.
It features 10 broadly diversified and sector ETFs from my HighVolume list as posted every Saturday. Furthermore, they are screened for the lowest MaxDD% number meaning they have been showing better resistance to temporary sell offs than all others over the past year.
The below table simply demonstrates the magnitude with which some of the ETFs are fluctuating in regards to their positions above or below their respective individual trend lines (%M/A). A break below, represented by a negative number, shows weakness, while a break above, represented by a positive percentage, shows strength.
For hundreds of ETF choices, be sure to reference Thursday’s StatSheet.
Year to date, here’s how the 2017 candidates have fared so far:
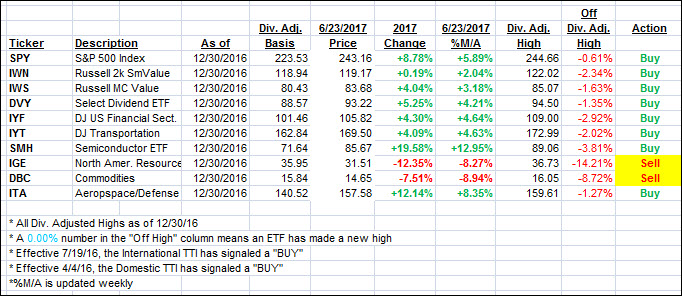
Again, the %M/A column above shows the position of the various ETFs in relation to their respective long term trend lines, while the trailing sell stops are being tracked in the “Off High” column. The “Action” column will signal a “Sell” once the -7.5% point has been taken out in the “Off High” column.
- Trend Tracking Indexes (TTIs)
Our Trend Tracking Indexes (TTIs) remained almost unchanged from yesterday as the markets are in dire need of a new driver to break out of the current sideways pattern.
Here’s how we closed 6/23/2017:
Domestic TTI: +3.57% (last close +3.55%)—Buy signal effective 4/4/2016
International TTI: +7.30% (last close +7.54%)—Buy signal effective 7/19/2016
Disclosure: I am obliged to inform you that I, as well as my advisory clients, own some of the ETFs listed in the above table. Furthermore, they do not represent a specific investment recommendation for you, they merely show which ETFs from the universe I track are falling within the guidelines specified.
————————————————————-
READER Q & A FOR THE WEEK
All Reader Q & A’s are listed at our web site!
Check it out at:
https://theetfbully.com/questions-answers/
———————————————————-
WOULD YOU LIKE TO HAVE YOUR INVESTMENTS PROFESSIONALLY MANAGED?
Do you have the time to follow our investment plans yourself? If you are a busy professional who would like to have his portfolio managed using our methodology, please contact me directly or get more details at:
https://theetfbully.com/personal-investment-management/
———————————————————
Back issues of the ETF/No Load Fund Tracker are available on the web at:
https://theetfbully.com/newsletter-archives/
Contact Ulli