
- Moving the Markets
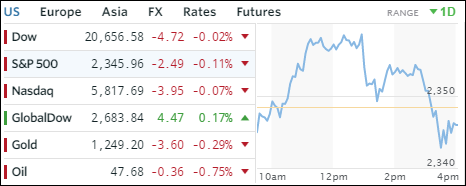
One look at the above chart shows the type of roller coaster ride the major indexes went through resulting from continued uncertainty about the outcome of the health care vote. In the end, hope of a passage got crushed as the vote got postponed on doubts that it can pass handing Trump a defeat, as his own party appeared to be split on the battle to repeal and replace “Obamacare.” The vote is now tentatively planned for Friday.
The major indexes gave back early gains and ended up slightly in the red, which was the Dow’s sixths straight day of losses. How wild was the ride? ZH summed it up nicely:
- 0855 Drop – Freedom Caucus Meeting postponed
- 0930 Rally – Brady – 95% agreement of health bill
- 0940 Drop – Brooks – 30-40 “no” votes still
- 1030 Rally – Freedom Caucus Meeting
- 1300 Drop – Freedom Caucus Meeting ends with no agreement
- 1330 Rally – Spicer press conference confirms vote will take place tonight
- 1505 Drop – Ryan Press Conference Postponed
- 1520 Rally – Trump “we have a chance”
- 1530 Drop – House delays vote on health bill amid doubts it can pass
- 1557 Rally – Freedom Caucus committed to working with the President
In the end, the gap between fact and fiction actually narrowed a little as the chart below shows:
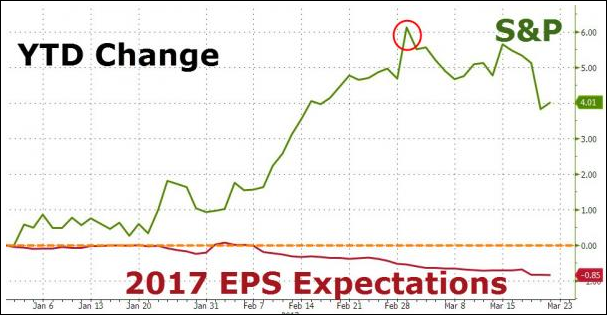
The question in my mind remains as to whether the S&P 500 will drop to the level of EPS expectations or if expectations will rally to meet the S&P level? My guess is the former. The timing of it is still the unknown.
- ETFs in the Spotlight (updated for 2017)
In case you missed the announcement and description of this section, you can read it here again.
It features 10 broadly diversified and sector ETFs from my HighVolume list as posted every Saturday. Furthermore, they are screened for the lowest MaxDD% number meaning they have been showing better resistance to temporary sell offs than all others over the past year.
The below table simply demonstrates the magnitude with which some of the ETFs are fluctuating in regards to their positions above or below their respective individual trend lines (%M/A). A break below, represented by a negative number, shows weakness, while a break above, represented by a positive percentage, shows strength.
For hundreds of ETF choices, be sure to reference Thursday’s StatSheet.
Year to date, here’s how the 2017 candidates have fared so far:
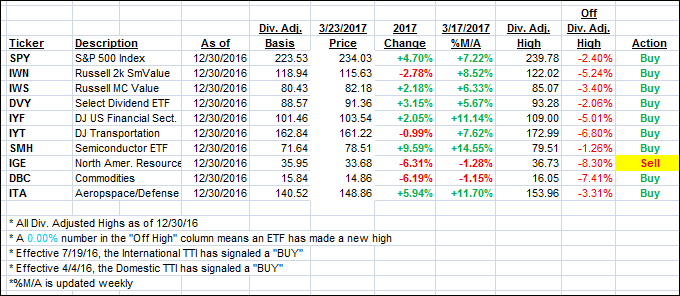
Again, the %M/A column above shows the position of the various ETFs in relation to their respective long term trend lines, while the trailing sell stops are being tracked in the “Off High” column. The “Action” column will signal a “Sell” once the -7.5% point has been taken out in the “Off High” column.
- Trend Tracking Indexes (TTIs)
Our Trend Tracking Indexes (TTIs) closed mixed with the Domestic one retreating and the International one advancing.
Here’s how we closed 3/23/2017:
Domestic TTI: +2.31% (last close +2.36%)—Buy signal effective 4/4/2016
International TTI: +5.63% (last close +5.43%)—Buy signal effective 7/19/2016
Disclosure: I am obliged to inform you that I, as well as my advisory clients, own some of the ETFs listed in the above table. Furthermore, they do not represent a specific investment recommendation for you, they merely show which ETFs from the universe I track are falling within the guidelines specified.
Contact Ulli