
- Moving the Markets
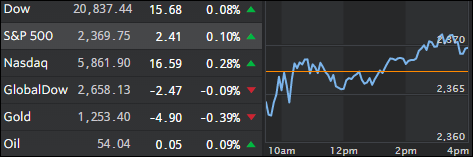
The wining streak continued despite a weak opening, but the bulls were determined not to interrupt the current march towards new record highs, and mid-day the major indexes slowly crawled above the unchanged line and eked out a tiny gain; but a gain nonetheless.
Throwing in an assist was President Trump when he upped the ante by stating that he’d make a “big” infrastructure statement on Tuesday. Additionally, he uttered those words that Wall Street wanted to hear, namely that he is seeking a “historic” increase in military spending of more than 9% while also reinforcing that his administration would be “moving quickly” on regulatory reforms.
All of this was a warm-up or a priming of the pump ahead of his first address to a joint session of Congress tomorrow night. If he provides more specifics on his plans and meets current hyped up expectations, we could see more upside in the markets. If, however, the picture remains murky with vague details combined with an uncertain time line, we could see a long overdue pullback set in confirming what is believed by some to be a “suckers” rally.
- ETFs in the Spotlight (updated for 2017)
In case you missed the announcement and description of this section, you can read it here again.
It features 10 broadly diversified and sector ETFs from my HighVolume list as posted every Saturday. Furthermore, they are screened for the lowest MaxDD% number meaning they have been showing better resistance to temporary sell offs than all others over the past year.
The below table simply demonstrates the magnitude with which some of the ETFs are fluctuating in regards to their positions above or below their respective individual trend lines (%M/A). A break below, represented by a negative number, shows weakness, while a break above, represented by a positive percentage, shows strength.
For hundreds of ETF choices, be sure to reference Thursday’s StatSheet.
Year to date, here’s how the 2017 candidates have fared so far:
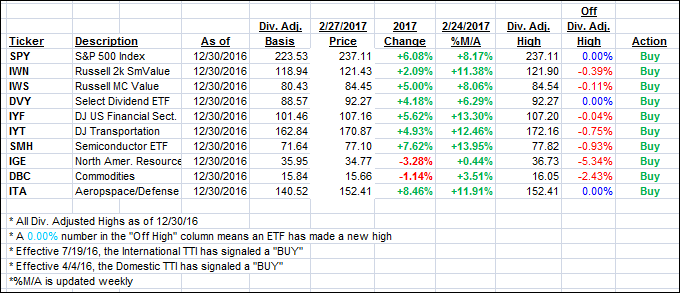
Again, the %M/A column above shows the position of the various ETFs in relation to their respective long term trend lines, while the trailing sell stops are being tracked in the “Off High” column. The “Action” column will signal a “Sell” once the -7.5% point has been taken out in the “Off High” column.
- Trend Tracking Indexes (TTIs)
Our Trend Tracking Indexes (TTIs) inched up a tad as the major indexes set new record highs but only by a fraction of a percent.
Here’s how we closed 2/27/2017:
Domestic TTI: +3.00% (last close +2.95%)—Buy signal effective 4/4/2016
International TTI: +5.07% (last close +5.03%)—Buy signal effective 7/19/2016
Disclosure: I am obliged to inform you that I, as well as my advisory clients, own some of the ETFs listed in the above table. Furthermore, they do not represent a specific investment recommendation for you, they merely show which ETFs from the universe I track are falling within the guidelines specified.
Contact Ulli