
1. Moving the Markets
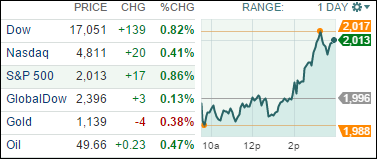
The stock rally on Wall Street picked up steam Thursday as investors focused on the Federal Reserve’s continued worries about low inflation after the release of minutes from the Fed’s latest policy meeting.
The Dow and S&P 500 had earlier flirted above and below the break-even marks of 17,000 and 2,000. But after reviewing the Fed minutes, in which the central bank said it was still worried about low inflation readings, stocks rallied as the odds for an interest rate hike this year seemed to shrink some more.
We have all been waiting for the earnings season to get underway. Today, Alcoa (AA) released its Q3 numbers not long after the closing bell. The results were disappointing. The company reported adjusted earnings per share of $0.07 ($0.13 estimated) and revenues of $5.6 billion ($5.64 billion expected), down 11% year-on-year. Alcoa is seen as a gauge for global manufacturing and as a big player in commodities. Its performance, comments on the markets and on China’s economy are telling.
All of our 10 ETFs in the Spotlight joined the party and closed up with the Mid-Cap Value being the winner with +1.25%. Lagging behind was Healthcare again (XLV) with +0.37%.
2. ETFs in the Spotlight
In case you missed the announcement and description of this section, you can read it here again.
It features 10 broadly diversified ETFs from my HighVolume list as posted every Monday. Furthermore, they are screened for the lowest MaxDD% number meaning they have been showing better resistance to temporary sell offs than all others over the past year.
Here are the 10 candidates:
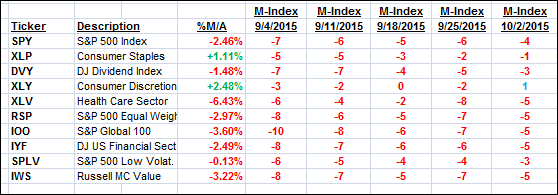
The above table simply demonstrates the magnitude with which some of the ETFs are fluctuating in regards to their positions above or below their respective individual trend lines (%M/A). A break below, represented by a negative number, shows weakness, while a break above, represented by a positive percentage, shows strength.
For hundreds of ETF/Mutual fund choices, be sure to reference Thursday’s StatSheet.
Year to date, here’s how the above candidates have fared so far:
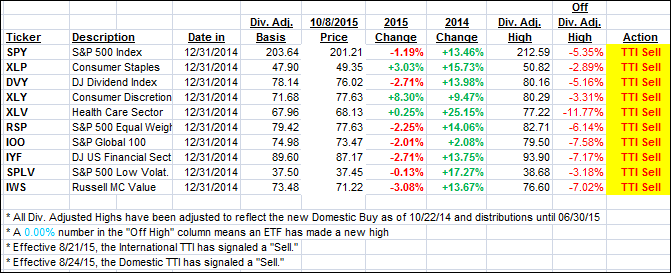
Again, the first table above shows the position of the various ETFs in relation to their respective long term trend lines (%M/A), while the second one tracks their trailing sell stops in the “Off High” column. The “Action” column will signal a “Sell” once the -7.5% point has been taken out in the “Off High” column.
3. Trend Tracking Indexes (TTIs)
Our Trend Tracking Indexes (TTIs) again moved closer to their trend lines but are still positioned on the bearish side by the following percentages:
Domestic TTI: -0.91% (last close -1.21%)—Sell signal effective 8/24/2015
International TTI: -3.75% (last close -4.26%)—Sell signal effective 8/21/2015
Until the respective trend lines get clearly broken to the upside, we are staying on the sidelines.
Disclosure: I am obliged to inform you that I, as well as advisory clients of mine, own some of these listed ETFs. Furthermore, they do not represent a specific investment recommendation for you, they merely show which ETFs from the universe I track are falling within the guidelines specified.
Contact Ulli