1. Moving the Markets
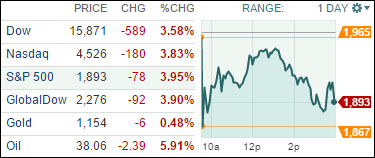
It all started with China’s Shanghai index dropping some 8.5% and the European markets following closely by losing some 5%. U.S. equities took a huge tumble at the opening, rallied back to almost even before succumbing to last hour selling.
China has been a story in itself with their index having gained this year at one point about 60%; it’s now in negative territory, which makes it another nail in the coffin of the buy-and-hold crowd.
The Dow was down a jaw dropping 1,000 points early on before recovering to a loss of “only” 589 points. Commodity prices continued their slide down the black diamond slope. Pricing was so out of whack this morning that the VIX did not have any quotes for some 30 minutes as it shot above the 50 level for the first time since 2009. Volatility was incredibly high as short option premiums soared and long ones got crushed.
As trend trackers it’s clear that the bear market has arrived, as I mentioned last Friday. What is not known is the magnitude of this event. For sure, there will be the usual menu of jawboning by the Fed as to the assistance they will give via a new QE program or the dismissal of the anticipated interest rate hike, or some other brilliant kick the can down the road plan. Just wait and listen for it…
The question in my mind is this: will any Fed action/promises have a long lasting effect on propping up the equity markets? The Chinese just tried it over the past few weeks and it failed miserably.
My point is that this event could be short lived or turn into a bear market disaster similar to 2008 or worse. Nobody knows. The smart thing right now is to be on the sidelines and let others take the hit. There will be a time when it safer to re-enter than right now. Remember the old saying that “I’d rather be out of the market wishing I was in, than in the market wishing I was out.”
All of our 10 ETFs in the Spotlight got hammered today as all markets did their best swan dive imitation. Good thing we had only one sector ETF left, which I sold during the morning rebound. At the close, the downside leader was surprisingly the Low Volatility ETF (SPLV), which gave back -5.28%. Getting spanked the least was the Select Dividend ETF (DVY) with -3.48%.
We are now clearly in bear market territory, as the TTIs in section 3 below show:
2. ETFs in the Spotlight
In case you missed the announcement and description of this section, you can read it here again.
It features 10 broadly diversified ETFs from my HighVolume list as posted every Monday. Furthermore, they are screened for the lowest MaxDD% number meaning they have been showing better resistance to temporary sell offs than all others over the past year.
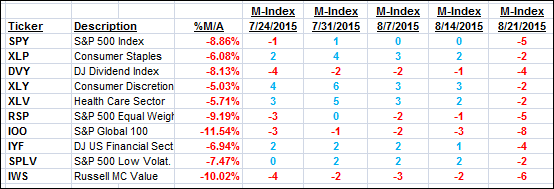
Here are the 10 candidates:
The above table simply demonstrates the magnitude with which some of the ETFs are fluctuating in regards to their positions above or below their respective individual trend lines (%M/A). A break below, represented by a negative number, shows weakness, while a break above, represented by a positive percentage, shows strength.
For hundreds of ETF/Mutual fund choices, be sure to reference Thursday’s StatSheet.
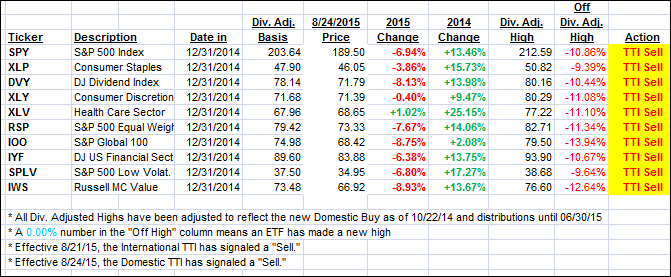
Year to date, here’s how the above candidates have fared so far:
Again, the first table above shows the position of the various ETFs in relation to their respective long term trend lines (%M/A), while the second one tracks their trailing sell stops in the “Off High” column. The “Action” column will signal a “Sell” once the -7.5% point has been taken out in the “Off High” column. Overriding the sell stop will be a break of the Trend Tracking Indexes (TTIs) below their respective trend lines, a condition which we have now reached.
3. Trend Tracking Indexes (TTIs)
Both of our Trend Tracking Indexes (TTIs) got crushed today validating our bearish position.
We are now in cash and will evaluate various asset classes to see if there is any bullishness left anywhere.
Here’s how we closed:
Domestic TTI: -3.64% (last close -2.01%)—Sell signal effective 8/24/2015
International TTI: -7.83% (last close -4.91%)—Sell signal effective 8/21/2015
Disclosure: I am obliged to inform you that I, as well as advisory clients of mine, own some of these listed ETFs. Furthermore, they do not represent a specific investment recommendation for you, they merely show which ETFs from the universe I track are falling within the guidelines specified.
Contact Ulli


