1. Moving the Markets
Shares of Apple (AAPL) fell 3.2%, making it the biggest losing stock of the Dow. The tech giant is under pressure as worries about an economic slowdown in China raises concerns about its biggest growth market.
On the economic front, investors continue to focus (speculatively) on when the Fed will boost interest rates, however, there has been little indication regarding the matter from Fed thus far in August.
In the world of entertainment, we heard some good news from Disney today. Walt Disney Co.’s (DIS) fiscal third quarter income rose 11% from a year ago to $2.5 billion as its major business lines, particularly movie production and cable networks, generated higher revenues. Media Networks, the Burbank, Calif.-based company’s largest division that runs ABC, ESPN and Disney cable networks, reported a 5% increase in revenue to $5.8 billion.
And in tech, of course Apple (AAPL) was back in the news today. The much loved tech company’s shares fell to $114.64, firmly below their 200-day daily moving average. The stock was the biggest drag on the three major U.S. indexes. Why the continued drop? Slower production in China and skepticism over demand for iPhones as other competitors increase product availability in the market.
Regarding economic news, the ISM Non-manufacturing Index will be announced on Wednesday, and Friday brings the biggest report of the week with July employment.
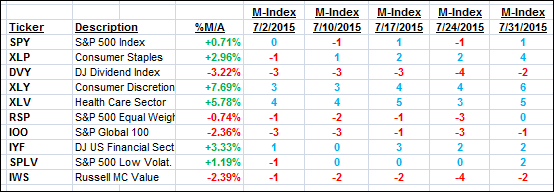
8 of our 10 ETFs in the Spotlight slipped just a tad with the Select Dividend ETF (DVY) taking the biggest hit by losing -0.54%. Managing to stay unchanged was Consumer Staples (XLP) while Consumer Discretionaries (XLY) gained +0.43%.
2. ETFs in the Spotlight
In case you missed the announcement and description of this section, you can read it here again.
It features 10 broadly diversified ETFs from my HighVolume list as posted every Monday. Furthermore, they are screened for the lowest MaxDD% number meaning they have been showing better resistance to temporary sell offs than all others over the past year.
Here are the 10 candidates:
The above table simply demonstrates the magnitude with which some of the ETFs are fluctuating in regards to their positions above or below their respective individual trend lines (%M/A). A break below, represented by a negative number, shows weakness, while a break above, represented by a positive percentage, shows strength.
For hundreds of ETF/Mutual fund choices, be sure to reference Thursday’s StatSheet.
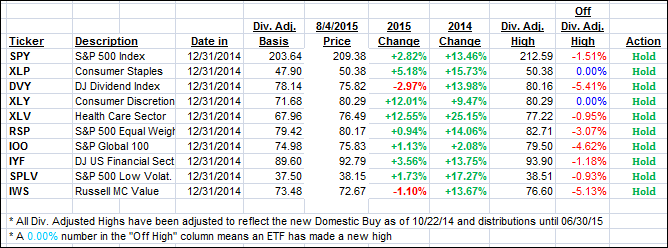
Year to date, here’s how the above candidates have fared so far:
Again, the first table above shows the position of the various ETFs in relation to their respective long term trend lines (%M/A), while the second one tracks their trailing sell stops in the “Off High” column. The “Action” column will signal a “Sell” once the -7.5% point has been taken out in the “Off High” column.
3. Trend Tracking Indexes (TTIs)
Our Trend Tracking Indexes (TTIs) again moved only a little bit from yesterday’s close”
Domestic TTI: +1.16% (last close +1.40%)—Buy signal effective 10/22/2014
International TTI: +0.97% (last close +1.22%)—Buy signal effective 2/13/2015
Disclosure: I am obliged to inform you that I, as well as advisory clients of mine, own some of these listed ETFs. Furthermore, they do not represent a specific investment recommendation for you, they merely show which ETFs from the universe I track are falling within the guidelines specified.
Contact Ulli


