
1. Moving the Markets
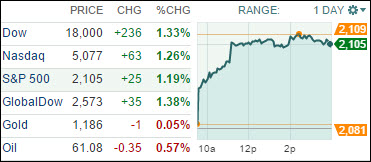
Stocks surged and bond yields hit nearly nine-month highs today as good news on Greek debt talks and U.S. wage growth encouraged investors to take some risk and invest. The mere hint of a thaw in the deadlock between Greece and its eurozone creditors is being viewed as a major positive by Wall Street and stocks reacted cooperatively.
In insurance news, we heard today that insurer Tokio Marine Holdings Inc. is going to be bought by HCC Insurance Holdings for $7.5B. The deal underscores how Japanese firms are focused on foreign markets in search of growth. Japan firms have now announced a year-to-date record of $50.1 billion of overseas acquisitions so far in 2015, up from $30.1 billion in the same period last year. The total for all of 2014 was $53.4 billion.
In tech news, Apple (AAPL) shares were on investors’ radar today. The tech powerhouse is reportedly facing antitrust scrutiny from regulators. Attorneys General of New York and Connecticut are probing whether major music industry firms colluded to restrain competition among streaming music services. This investigation comes as Apple launches its $10 a month music streaming service. Regardless, shares gained 1.15% on the day.
And if you are an oil bull, the news was all good today as crude rose above $60 a barrel, which is up considerably since the winter months earlier this year.
All of our 10 ETFs in the Spotlight joined the newly found upward momentum and rocketed higher. Leading the charge was the Global 100 ETF (IOO) with +1.70%, while the “laggard” was Consumer Staples (XLP) with only +0.98%.
2. ETFs in the Spotlight
In case you missed the announcement and description of this section, you can read it here again.
It features 10 broadly diversified ETFs from my HighVolume list as posted every Monday. Furthermore, they are screened for the lowest MaxDD% number meaning they have been showing better resistance to temporary sell offs than all others over the past year.
Here are the 10 candidates:
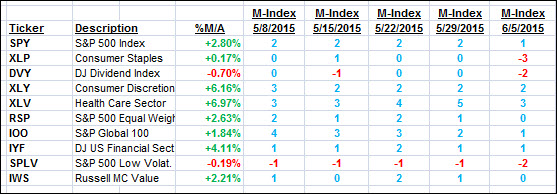
The above table simply demonstrates the magnitude with which some of the ETFs are fluctuating in regards to their positions above or below their respective individual trend lines (%M/A). A break below, represented by a negative number, shows weakness, while a break above, represented by a positive percentage, shows strength.
For hundreds of ETF/Mutual fund choices, be sure to reference Thursday’s StatSheet.
Year to date, here’s how the above candidates have fared so far:
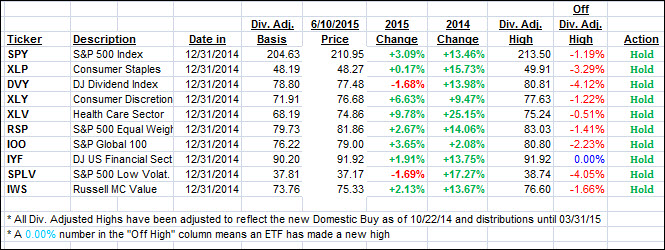
Again, the first table above shows the position of the various ETFs in relation to their respective long term trend lines (%M/A), while the second one tracks their trailing sell stops in the “Off High” column. The “Action” column will signal a “Sell” once the -7.5% point has been taken out in the “Off High” column.
3. Trend Tracking Indexes (TTIs)
Our Trend Tracking Indexes (TTIs) recovered from the recent pullback and closed up moving deeper into bullish territory:
Domestic TTI: +1.85% (last close +1.32%)—Buy signal effective 10/22/2014
International TTI: +3.85% (last close +2.65%)—Buy signal effective 2/13/2015
Disclosure: I am obliged to inform you that I, as well as advisory clients of mine, own some of these listed ETFs. Furthermore, they do not represent a specific investment recommendation for you, they merely show which ETFs from the universe I track are falling within the guidelines specified.
Contact Ulli