
1. Moving the Markets
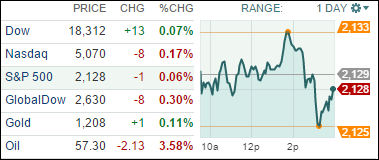
It was a struggle for the indexes today, as the upward momentum of the last few days waned and even a last hour rebound lacked spunk and turned out not to be enough for the S&P and Nasdaq to cross above the unchanged line.
Energy stocks sold off sharply as oil prices hit the skids. Since nowadays good news is bad news, the sharp increase in housing starts was seen as a negative and stocks meandered. Why? Because it’s all about the Fed and if/when they will raise interest rates. That means positive economic data will be seen as aiding the Fed in potentially hiking the rates sooner rather than later.
3 of our 10 ETFs in the Spotlight managed to resist this non-directional trading day and closed up with the leader being the Financials (IYF) with a 0.50% gain. On the downside, Consumer Staples (XLP) fared the worst by giving back 0.26%.
2. ETFs in the Spotlight
In case you missed the announcement and description of this section, you can read it here again.
It features 10 broadly diversified ETFs from my HighVolume list as posted every Monday. Furthermore, they are screened for the lowest MaxDD% number meaning they have been showing better resistance to temporary sell offs than all others over the past year.
Here are the 10 candidates:
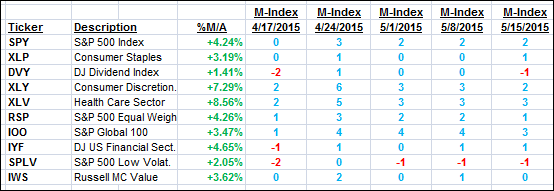
The above table simply demonstrates the magnitude with which some of the ETFs are fluctuating in regards to their positions above or below their respective individual trend lines (%M/A). A break below, represented by a negative number, shows weakness, while a break above, represented by a positive percentage, shows strength.
For hundreds of ETF/Mutual fund choices, be sure to reference Thursday’s StatSheet.
Year to date, here’s how the above candidates have fared so far:
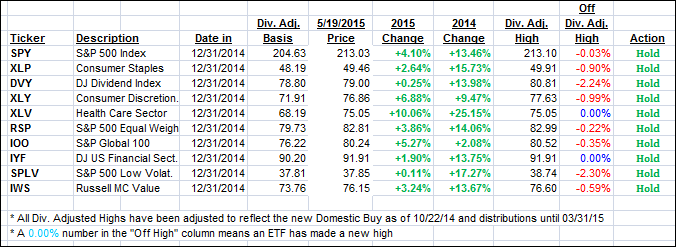
Again, the first table above shows the position of the various ETFs in relation to their respective long term trend lines (%M/A), while the second one tracks their trailing sell stops in the “Off High” column. The “Action” column will signal a “Sell” once the -7.5% point has been taken out in the “Off High” column.
3. Trend Tracking Indexes (TTIs)
Our Trend Tracking Indexes (TTIs) slipped a tad as the major indexes closed mixed:
Domestic TTI: +2.80% (last close +2.90%)—Buy signal effective 10/22/2014
International TTI: +5.47% (last Friday +5.57%)—Buy signal effective 2/13/2015
Disclosure: I am obliged to inform you that I, as well as advisory clients of mine, own some of these listed ETFs. Furthermore, they do not represent a specific investment recommendation for you, they merely show which ETFs from the universe I track are falling within the guidelines specified.
Contact Ulli