
1. Moving the Markets
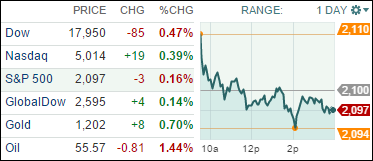
Stocks closed mixed as the Nasdaq jumped back above 5,000 but the Dow was dragged lower by mixed earnings news.
At the top of headlines today was Yahoo! (YHOO). The company missed earnings and revenue forecasts for Q1, which sorely disappointed investors that were hoping for a rebound to start off 2015. The company reported adjusted earnings of 15 cents a share, which is down 61% from the year-ago quarter. That missed forecasts calling for a profit of 18 cents a share. Shares are down 1.4% in afterhours trading.
As for M&A, we heard some positive news in the pharma space. In a potentially $40 billion pharma deal, Teva Pharmaceutical (TEVA) offered $82 per share for Mylan (MYL). Teva’s shares rose 1.9% and Mylan’s surged 8.9%.
Internationally, stock markets marched higher today, boosted by investor optimism over recent stimulus efforts, market reform measures in China and quarterly earnings from U.S. and European companies.
4 our 10 ETFs in the Spotlight managed to eke out a gain with XLV being the leader sporting a gain of 0.66%. On the downside, the laggard of the day was DVY with a 0.56% loss.
2. ETFs in the Spotlight
In case you missed the announcement and description of this section, you can read it here again.
It features 10 broadly diversified ETFs from my HighVolume list as posted every Monday. Furthermore, they are screened for the lowest MaxDD% number meaning they have been showing better resistance to temporary sell offs than all others over the past year.
Here are the 10 candidates:
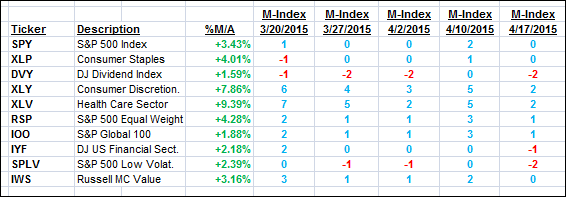
The above table simply demonstrates the magnitude with which some of the ETFs are fluctuating in regards to their positions above or below their respective individual trend lines (%M/A). A break below, represented by a negative number, shows weakness, while a break above, represented by a positive percentage, shows strength.
For hundreds of ETF/Mutual fund choices, be sure to reference Thursday’s StatSheet.
Year to date, here’s how the above candidates have fared so far:
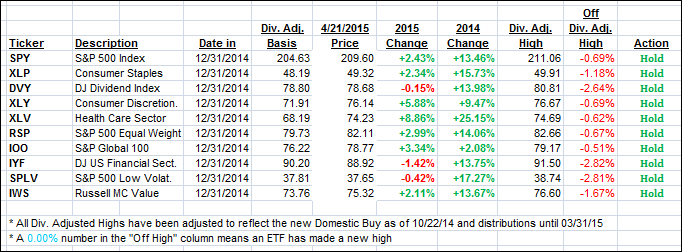
Again, the first table above shows the position of the various ETFs in relation to their respective long term trend lines (%M/A), while the second one tracks their trailing sell stops in the “Off High” column. The “Action” column will signal a “Sell” once the -7.5% point has been taken out in the “Off High” column.
3. Trend Tracking Indexes (TTIs)
Our Trend Tracking Indexes (TTIs) were mixed with the International one gaining more solidly during this non-directioal day.
Here’s how we ended up:
Domestic TTI: +3.34% (last close +3.31%)—Buy signal effective 10/22/2014
International TTI: +4.81% (last close +4.48%)—Buy signal effective 2/13/2015
Disclosure: I am obliged to inform you that I, as well as advisory clients of mine, own some of these listed ETFs. Furthermore, they do not represent a specific investment recommendation for you, they merely show which ETFs from the universe I track are falling within the guidelines specified.
Contact Ulli