
1.Moving the Markets
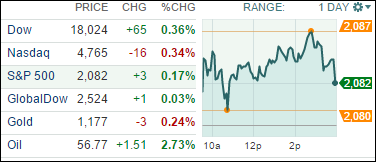
Markets continued their rally today following news reports of continued economic growth and the strongest consumer sentiment we have seen since 2007. The government released numbers today that showed GDP expanded at a seasonally adjusted annual rate of 5% for the three months ended September 30th. The S&P 500 gained 0.2%, the Dow rose 0.4% (closing at 18,024.17 a record), however, the Nasdaq dropped 0.3%. Markets continue to rock and roll through the Holiday season and aren’t showing signs of reversing the trend heading into 2015.
Part of continued economic growth can likely be attributed to gas prices remaining low, as they continue to fall at the pump. You may be shocked to know that the price of gas has actually fallen for 89 consecutive days now! This is the longest streak on record according to AAA. For the first time in five years, prices are now as low as $2.38 a gallon.
In corporate news, investors in Keurig Green Mountain Inc didn’t have much to be happy about today. The company announced it is recalling about 7.2 million home brewing machines because they could overheat and be hazardous to users. Shares fell 2.2% after the news. Keurig has received about 200 reports of hot liquid escaping from the brewer, including 90 reports of burn related injuries, the U.S. Consumer Product Safety Commission said.
Let’s hope that consumer spending throughout the rest of the Holiday season and low oil prices will continue to drive markets higher to close out the year.
9 of our 10 ETFs in the Spotlight rallied with 7 of them making new highs in the process as table 3 below shows.
2. ETFs in the Spotlight
In case you missed the announcement and description of this section, you can read it here again.
It features 10 broadly diversified ETFs from my HighVolume list as posted every Monday. Furthermore, they are screened for the lowest MaxDD% number meaning they have been showing better resistance to temporary sell offs than all others over the past year.
Here are the 10 candidates:
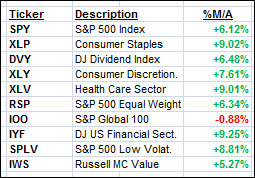
The above table simply demonstrates the magnitude with which some of the ETFs are fluctuating in regards to their positions above or below their respective individual trend lines (%M/A). A break below, represented by a negative number, shows weakness, while a break above, represented by a positive percentage, shows strength.
Year to date, here’s how the above candidates have fared so far:
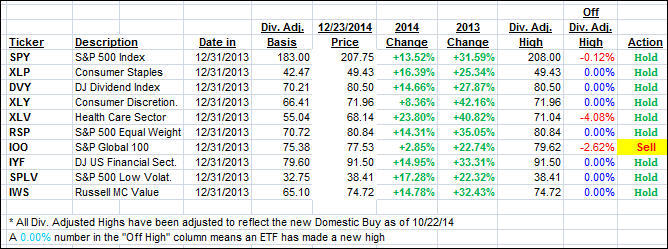
Again, the first table above shows the position of the various ETFs in relation to their respective long term trend lines (%M/A), while the second one tracks their trailing sell stops in the “Off High” column. The “Action” column will signal a “Sell” once the -7.5% point has been taken out in the “Off High” column.
3. Trend Tracking Indexes (TTIs)
Our Trend Tracking Indexes (TTIs) changed only immaterially and ended the day as follows:e
Domestic TTI: +3.24% (last close +3.31%)—Buy signal since 10/22/2014
International TTI: +0.09% (last close +0.04%)—New Sell signal effective 12/15/14
Disclosure: I am obliged to inform you that I, as well as advisory clients of mine, own some of these listed ETFs. Furthermore, they do not represent a specific investment recommendation for you, they merely show which ETFs from the universe I track are falling within the guidelines specified.
Contact Ulli