1. Moving the Markets
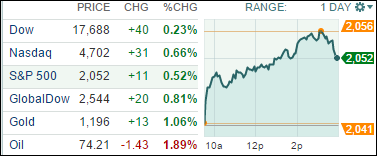
All major U.S. indexes closed higher today, driven mostly by the health care sector and positive news from abroad. The S&P 500 rose 0.5%, the Dow gained 0.2% and the Nasdaq jumped 0.7%.
The news from abroad was mostly centered on Japan and Germany. Japan’s Prime Minister Shinzo Abe informed government leaders that he would postpone a sales tax increase to 2017, which was initially planned for 2015. This announcement received notable praise because the proposed 2015 sales tax hike would have offset much of the stimulus the government is currently pumping into the weakened domestic economy.
On the German front, the good news today centered around an economic rebound. Today we heard reports that a measure of German economic confidence improved for the first time in nearly a year. Over the past 12 months, Germany’s export-oriented economy has been hit by mounting tensions with Russia over the Ukraine crisis and also, to a lesser degree, by the conflicts in the Middle East. Many analysts were quick to remind that the economic climate in Germany (and the EU as a whole) remained fragile due to ongoing political tensions.
And, on the tech front, there was a lot of buzz today about how Apple (AAPL) could be the first $1 trillion company. At present, Apple has a market cap close to $670 billion. That’s more valuable than any other company in the S&P 500, and is more than the GDP of Indonesia. Microsoft is Number 2 at $409 billion. Can the cultish company reach the $1 trillion mark? Only the future will tell.
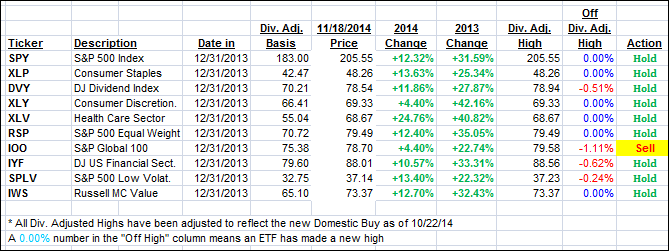
All of our 10 ETFs in the Spotlight gained on the day with 6 of them making new highs as the YTD table below shows.
2. ETFs in the Spotlight
In case you missed the announcement and description of this section, you can read it here again.
It features 10 broadly diversified ETFs from my HighVolume list as posted every Monday. Furthermore, they are screened for the lowest MaxDD% number meaning they have been showing better resistance to temporary sell offs than all others over the past year.
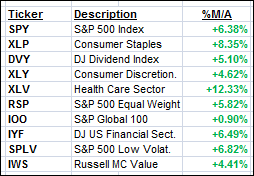
Here are the 10 candidates:
The above table simply demonstrates the magnitude with which some of the ETFs are fluctuating in regards to their positions above or below their respective individual trend lines (%M/A). A break below, represented by a negative number, shows weakness, while a break above, represented by a positive percentage, shows strength.
Year to date, here’s how the above candidates have fared so far:
Again, the first table above shows the position of the various ETFs in relation to their respective long term trend lines (%M/A), while the second one tracks their trailing sell stops in the “Off High” column. The “Action” column will signal a “Sell” once the -7.5% point has been taken out in the “Off High” column.
3. Trend Tracking Indexes (TTIs)
Our Trend Tracking Indexes (TTIs) both gained with the International one now having pierced its trend line again to the upside. I will wait to see if it shows any staying power before declaring a new ‘Buy’ in this arena.
Here’s how we ended up:
Domestic TTI: +3.30% (last close +2.96%)—Buy signal since 10/22/2014
International TTI: +0.57% (last close -0.11%)—Sell signal since 10/1/2014
Disclosure: I am obliged to inform you that I, as well as advisory clients of mine, own some of these listed ETFs. Furthermore, they do not represent a specific investment recommendation for you, they merely show which ETFs from the universe I track are falling within the guidelines specified.
Contact Ulli


