ETF/No Load Fund Tracker StatSheet
————————————————————-
THE LINK TO OUR CURRENT ETF/MUTUAL FUND STATSHEET IS:
————————————————————
Market Commentary
Friday, November 14, 2014
MARKETS BOOK A FOURTH STRAIGHT WEEK OF GAINS HEADING INTO THE HOLIDAY SEASON
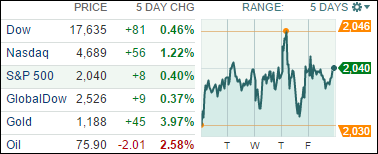
[Chart courtesy of MarketWatch.com]1. Moving the Markets
Trading was a bit volatile today, but the S&P 500 managed to mark another record high, and U.S. markets across the board posted another week of gains. On the day, the indexes inched up only slightly, however, for the week, the Dow was up 0.4%, the S&P 500 gained 0.4% and the Nasdaq surged 1.2%.
Volatility in trading persisted throughout the day, despite investors receiving a solid report on October retail sales. They came in about 0.3% higher, which should add a bit of bullish sentiment to retail investors heading into the holiday season. Perhaps the boost was due to a lessened burden on consumers’ wallets at the gas pump over the past two months. As you know, crude oil prices have been falling of late, however, the benchmark U.S. crude index did rise 2.4% today to $75.97 a barrel.
In case you didn’t hear, Virgin America (VA) had their IPO today. The young and fresh airline had an initial price of $23 per share, but the stock began trading on the Nasdaq at $27 per share and shares crept higher throughout the day to close at an even $30.00. I imagine Richard Branson enjoyed a cocktail accordingly at the close of trading.
For the week ahead, manufacturing will be in focus with the release of Industrial Production numbers. The strength of housing activity will also receive a closer look with the release of housing starts, building permits and existing home sales.
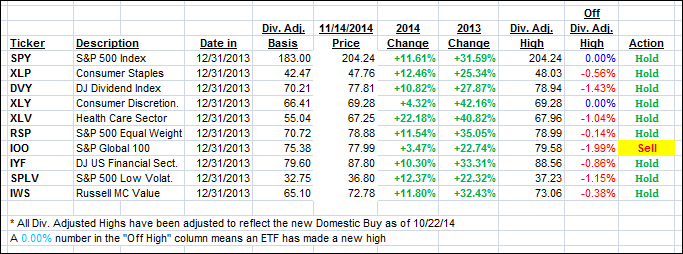
4 of our 10 ETFs in the Spotlight managed to close up while 2 of them made new highs as the YTD table below shows.
2. ETFs in the Spotlight
In case you missed the announcement and description of this section, you can read it here again.
It features 10 broadly diversified ETFs from my HighVolume list as posted every Monday. Furthermore, they are screened for the lowest MaxDD% number meaning they have been showing better resistance to temporary sell offs than all others over the past year.
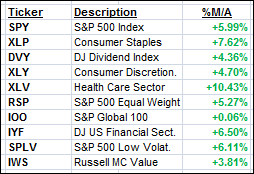
Here are the 10 candidates:
The above table simply demonstrates the magnitude with which some of the ETFs are fluctuating in regards to their positions above or below their respective individual trend lines (%M/A). A break below, represented by a negative number, shows weakness, while a break above, represented by a positive percentage, shows strength.
Year to date, here’s how the above candidates have fared so far:
Again, the first table above shows the position of the various ETFs in relation to their respective long term trend lines (%M/A), while the second one tracks their trailing sell stops in the “Off High” column. The “Action” column will signal a “Sell” once the -7.5% point has been taken out in the “Off High” column.
3. Trend Tracking Indexes (TTIs)
Our Trend Tracking Indexes (TTIs) meandered with the International one improving but not yet to a point where a new Buy signal is warranted, since this TTI has been crawling slightly above and below its trend line for the better part of a week without making any clear headway in either direction.
Here’s how we ended the week:
Domestic TTI: +3.13% (last Friday +3.09%)—Buy signal since 10/22/2014
International TTI: +0.20% (last Friday -0.30%)—Sell signal since 10/1/2014
Have a nice weekend.
Ulli…
Disclosure: I am obliged to inform you that I, as well as advisory clients of mine, own some of these listed ETFs. Furthermore, they do not represent a specific investment recommendation for you, they merely show which ETFs from the universe I track are falling within the guidelines specified.
————————————————————-
READER Q & A FOR THE WEEK
All Reader Q & A’s are listed at our web site!
Check it out at:
http://www.successful-investment.com/q&a.php
Reader Larry:
Q: Ulli: Thanks so much for the information that you share. It has helped me tremendously and freed up a lot of time, to boot.
I am wondering what your thoughts are re: buying put options to help protect profits – along with your stop loss rules, of course. It seems that this might help to preserve profits in the event of a down turn. I am thinking of puts that would be about 6 or 8 weeks out, and perhaps of protecting a part of my holdings.
Thanks again.
A: Larry: Sure, you can buy put options on the indexes to protect part of your assets from a sudden decline. Your timing has to be pretty good; otherwise the cost of the put options will eat into your gains.
———————————————————-
WOULD YOU LIKE TO HAVE YOUR INVESTMENTS PROFESSIONALLY MANAGED?
Do you have the time to follow our investment plans yourself? If you are a busy professional who would like to have his portfolio managed using our methodology, please contact me directly or get more details at:
https://theetfbully.com/personal-investment-management/
———————————————————
Back issues of the ETF/No Load Fund Tracker are available on the web at:
https://theetfbully.com/newsletter-archives/
Contact Ulli


