1. Moving the Markets
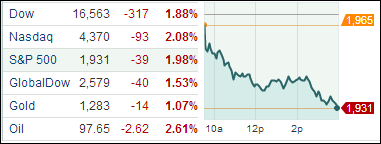
Nothing goes up forever, so the inevitable was bound to happen sooner or later. The last day of the month was as good as any for the S&P 500 to not only post its worst loss since April but also its first monthly decline since January. The other major indexes pulled back as well, as the chart above shows.
The culprits were several with the first one being the largest rise in labor costs in 5-1/2 years sparking concerns that the Fed might push interest rates higher much sooner than expected despite recent jawboning to the opposite. As a result, all 10 S&P sectors fell with energy leading downward momentum.
While the S&P and Nasdaq remain on the plus side of the ledger YTD, the Dow has slipped into negative territory. More potential weakness ahead was signaled by the S&P dropping below its 50-day moving average.
International news did not help matters as Argentina defaulted on its debt, while Russia banned soy imports from the Ukraine and may restrict Greek fruit and U.S. poultry as part of its ongoing tit-for-tat battle.
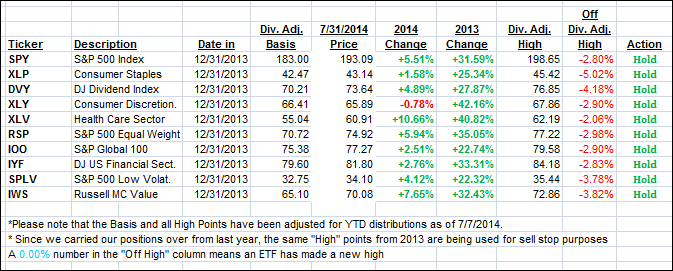
Our 10 ETFs in the Spotlight slipped with the indexes, 2 dropped below their respective long-term trend lines and one went negative year to day. For more details, please see the tables below.
2. ETFs in the Spotlight
In case you missed the announcement and description of this section, you can read it here again.
It features 10 broadly diversified ETFs from my HighVolume list as posted every Monday. Furthermore, they are screened for the lowest MaxDD% number meaning they have been showing better resistance to temporary sell offs than all others over the past year.
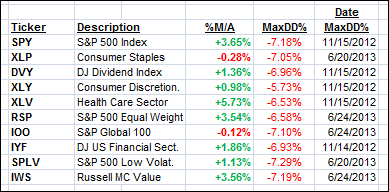
Here are the 10 candidates:
8 of them are remaining in “buy” mode, meaning their prices are above their respective long term trend lines by the percentage indicated (%M/A).
Year to date, here’s how the above candidates have fared so far:
To be clear, the first table above shows the position of the various ETFs in relation to their respective long term trend lines (%M/A), while the second one tracks their trailing sell stops in the “Off High” column. The “Action” column will signal a “Sell” once the -7.5% point is taken out in the “Off High” column.
3. Domestic Trend Tracking Indexes (TTIs)
Our Trend Tracking Indexes (TTIs) took a detour and headed south but remain on the bullish side of their respective trend lines:
Domestic TTI: +1.25% (last close +2.41%)
International TTI: +1.48% (last close +2.74%)
Disclosure: I am obliged to inform you that I, as well as advisory clients of mine, own some of these listed ETFs. Furthermore, they do not represent a specific investment recommendation for you, they merely show which ETFs from the universe I track are falling within the guidelines specified.
Contact Ulli


