1. Moving The Markets
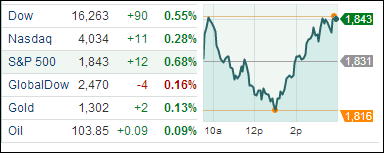
The S&P 500 rose today, along with all ten industry sectors. While the markets have rebounded well over the past two days, all three major indexes remain down for the month and the year. We saw positive earnings reports from both Coca-cola (KO) and Johnson & Johnson (JNJ) today as traders remain focused on what the latest wave of quarterly earnings will say about the health of the U.S. economy and companies. Several other major companies, including Google (GOOG), American Express (AMEX), Bank of America (BAC) and IBM (IBM) are due to report results on Wednesday.
TripAdvisor (TRIP) led all the risers in the S&P 500 index, gaining 4.4% to reach $83.30, while PetSmart (PETM) posted the steepest drop among companies in the S&P 500 index after an analyst downgraded the stock, saying new competition in pet care will create trouble for the retailer. The stock fell 4% to $66.61.
Gold broke below the key 200-day moving average today, which caused the commodity to tumble a total of about 2%. We also saw silver and platinum continue to be sold off after Monday’s rally across the board. Chinese firms were making “golden” news today as we heard they may have locked up as much as 1,000 tonnes of gold in financing deals. Analysts speculate that the financing-related buying in the world’s top gold consumer means prices could come under pressure if imports are hit by a broader crackdown on using commodities for finance.
Our 10 ETFs in the Spotlight improved with one of them still remaining below its long term trend line; 8 of them are now in the green YTD.
2. ETFs in the Spotlight
In case you missed the announcement and description of this section, you can read it here again.
It features 10 broadly diversified ETFs from my HighVolume list as posted every Monday. Furthermore, they are screened for the lowest MaxDD% number meaning they have been showing better resistance to temporary sell offs than all others over the past year.
In other words, none of them ever triggered their 7.5% sell stop level during this time period, which included a variety of severe market pullbacks but no move into outright bear market territory.
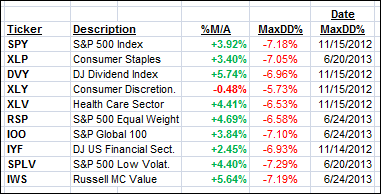
Here are the 10 candidates:
All of them are in “buy” mode, with the exception of XLY, meaning their prices are above their respective long term trend lines by the percentage indicated (%M/A).
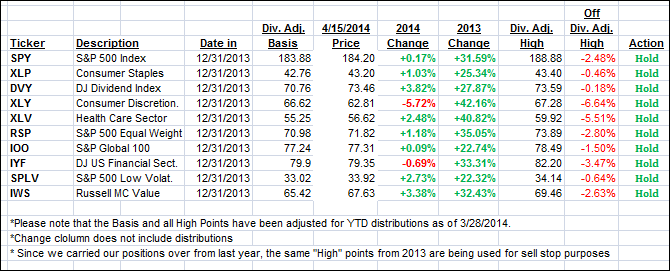
Year to date, here’s how the above candidates have fared so far:
To be clear, the first table above shows the position of the various ETFs in relation to their respective long term trend lines (%M/A), while the second one tracks their trailing sell stops in the “Off High” column. The “Action” column will signal a “Sell” once the -7.5% point is taken out in the “Off High” column.
3. Domestic Trend Tracking Indexes (TTIs)
Our Trend Tracking Indexes (TTIs) closed mixed with the Domestic one heading higher while the International one remained unchanged:
Domestic TTI: +1.82% (last close +1.53%)
International TTI: +2.22% (last close +2.22%)
Disclosure: I am obliged to inform you that I, as well as advisory clients of mine, own some of these listed ETFs. Furthermore, they do not represent a specific investment recommendation for you, they merely show which ETFs from the universe I track are falling within the guidelines specified.
Contact Ulli


