The ETF/No Load Fund Tracker
Monthly Review—January 31, 2013
US Stocks End January With Losses; Europe Posts Biggest Decline Since June
US stocks suffered their worst monthly decline in over a year in January as disappointing earnings, a continuing selloff in emerging markets and renewed fears over a looming deflation in the euro zone sapped investor confidence.
The S&P 500 index closed out January at 1,783, capping its monthly loss at 3.6 percent. Seven of the ten sectors finished the month lower with energy declining the most and shedding 6.3 percent. Consumer-discretionary was the second-weakest sector and followed energy closely with a 6.0 percent slump.
Both the DJIA and the S&P 500 marked their worst monthly declines since May 2012.
Stock markets witnessed heavy selling towards the end of the month as a steep drop in emerging market currencies prompted anxious investors to flee riskier assets. The Federal Reserve’s decision to reduce its monthly assets purchase by another $10 billion to $65 billion triggered the rout in emerging market currencies, as spooked investors set off capital outflows on fears of a liquidity tightening in the US. Some analysts said, however, the correction was expected as equities rose too fast at the end of last year.
The US economy continued to trudge along although the fourth-quarter advance GDP estimate showed an increase of 3.2 percent, tallying annual GDP at 1.9 percent. That compares with the 2.8 percent growth witnessed in 2012. Economists attributed the slowdown to large tax hikes and sharp government spending cuts that came into effect in the first half of 2013.
Consumer spending, the largest component of the economy that constitutes nearly 70 percent of gross domestic product, rose a seasonally adjusted 0.4 percent in December after an upwardly revised 0.6 percent rise in November. Spending could experience headwinds in the earlier part of the year as some 1.35 million Americans are likely to be affected after the Jan 1 cutoff in extra jobless benefits.
Nevertheless, the economy continued to paint a mixed picture in January. Orders for durable goods fell 4.3 percent in December although business capital spending rose at the fastest rate in nearly two years.
The much awaited Case/Shiller composite index revealed US home prices ticked down 0.1 percent in November with nine of the 20 cities tracked showing price drops. Still, home prices were up 13.7 percent over the same period in 2012, which marked the fastest annual growth since early 2006. Median home prices rose 8.4 percent to $265,800 from the prior year.
Across the Atlantic, the Stoxx Europe 600 index lost 1.8 percent in January to mark its worst monthly loss since June.
The threat of a looming deflation in the currency bloc continued to haunt investors. Data released by the European Union’s statistics office Eurostat showed January inflation dropped to 0.7 percent from 0.8 percent in the prior month, stoking fears of a spiraling decline in consumer prices that could derail the fragile recovery.
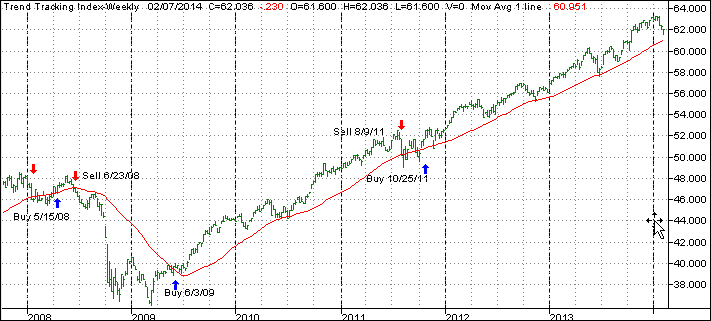
While the major trend direction, as measured by my Domestic Trend Tracking Index (TTI), remains bullish, short-term, we have seen a reversal that has brought us to within striking distance of a break below the trend line (red) and into bear market territory. We will have to wait and see as to whether that will actually materialize or not. Here’s the latest TTI chart:
The index itself (green line) still hovers above the trend line (red) by +1.15%.
With the market pullback in January and into early February, some our holdings headed south as well and triggered our tailing sell stops.
The 12-months chart below clearly shows the top in the markets (red arrow) and the subsequent decline of our various positions as we headed into January.
The weakest of the bunch was consumer staples (XLP) which, despite its conservative nature, has been on a slowdown since mid-November. Our sell stop was triggered towards the end of January, and the position was liquidated.
The fund with the sharpest drop was the Consumer Discretionary ETF (XLY), which showed the greatest volatility, tripped our sell stop in early February and was liquidated as well. We are holding all others for the time being, and I am prepared to pull the trigger should the need arise.
It’s too early to tell whether this current sell-off will continue and push us into outright bear market territory or if some sudden positive economic data points will save the month. We have suddenly slipped into quicksand and it’s important that we stay with our exit strategy just in case the bear returns with a vengeance and presents a repeat performance of 2008, a year with devastating consequences that most investors already have conveniently forgotten.
Contact Ulli

